


Executive summary
Unlock the secrets to customer success with our comprehensive guide on the 17 crucial metrics that define your business’s health and growth potential. This blog delves deep into each metric, from Customer Satisfaction Score (CSAT) to Revenue Churn, offering clear explanations and precise calculation methods. Enhance your strategic insights and drive business decisions with a thorough understanding of these pivotal customer success KPIs, ensuring your company meets and exceeds customer expectations in every interaction.
In the intricate world of business success, understanding and measuring customer success metrics is just like mastering the art of customer satisfaction. Each metric, a beat in the rhythm of your company’s relationship with its customers, tells a story of triumphs and challenges, guiding you to fine-tune your performance. As the business landscape evolves, these metrics become the critical lifelines that breathe life into customer relationships. It turns satisfied customers into loyal advocates and drives sustainable growth.
The advent of sophisticated technologies like AI and data analytics has revolutionized the way businesses approach customer success. These innovations provide a granular view of customer interactions, enabling businesses to anticipate needs, personalize experiences, and proactively address issues before they escalate. As we delve into the world of customer success metrics, we uncover not just numbers but the heartbeats of customer relationships that propel businesses toward unparalleled success.
Related must-reads:
- Empathy in customer service: Importance + how to improve
- 15 Customer service goals for businesses in 2024
- Omnichannel customer service – [Strategy + Examples]
- Customer service automation: Benefits and examples
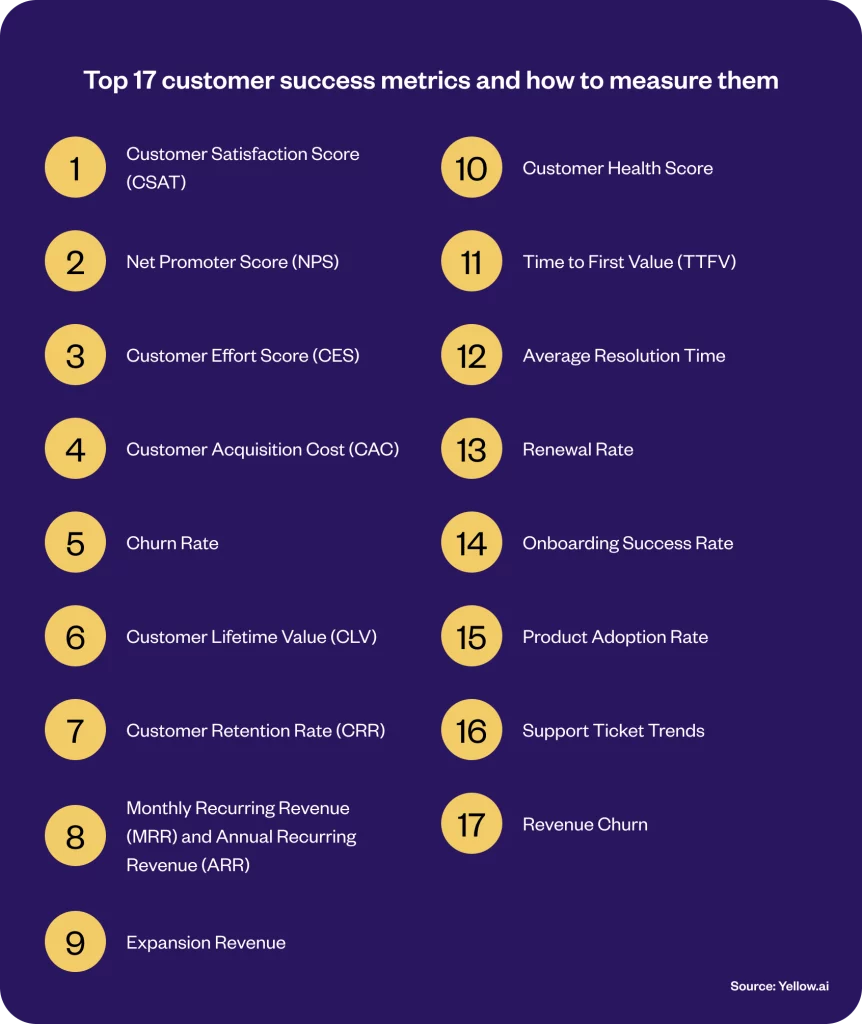
Top 17 customer success metrics and how to measure them
Discover the top 17 customer success metrics and learn how to effectively measure them to enhance your business strategy and growth.
1. Customer Satisfaction Score (CSAT)
Customer Satisfaction Score (CSAT) acts as a vital gauge, revealing how content customers are with a company’s offerings, whether it be a product, service, or any form of interaction. This metric is commonly derived from surveys where customers express their level of satisfaction on a specified scale. The essence of CSAT lies in its ability to furnish real-time insights into customer experiences, offering businesses a lens to assess and refine their service delivery and product quality.
Understanding CSAT is crucial for businesses as it directly reflects the customer’s perception of their brand and services. High CSAT scores indicate customer happiness and success in meeting or exceeding expectations, which can lead to repeat business, loyalty, and positive word-of-mouth. Conversely, lower scores signal areas needing improvement, providing businesses with actionable insights to enhance customer experiences.
Related read: How to Improve Customer Satisfaction in 2024?
How to calculate:
CSAT is calculated by dividing the number of positive responses by the total number of responses, then multiplying by 100 to convert it into a percentage.
CSAT = (Number of satisfied customers / Total survey responses) × 100
Imagine a company receiving 200 survey responses, with 150 responses rating their satisfaction level as high. The CSAT score would be calculated as follows:
CSAT = (150 / 200) × 100 = 75%
A 75% CSAT score indicates that three-quarters of the customers surveyed were satisfied with their experience, highlighting strengths in the business’s customer service or product quality. However, it also suggests room for improvement to increase satisfaction levels.
2. Net Promoter Score (NPS)
Net Promoter Score (NPS) measures customer loyalty and the likelihood of customers recommending a company’s products or services to others. Based on their likelihood to recommend, it categorizes customers into Promoters, Passives, and Detractors. NPS is an indicator of overall customer satisfaction and brand perception.
NPS is vital for businesses as it helps identify customer advocates (Promoters) and those who are less satisfied (Detractors). This metric predicts business growth and customer loyalty. A high NPS signifies strong customer relationships and potential for positive referrals, while a low NPS can alert businesses to underlying issues that may affect customer retention and brand reputation.
How to calculate:
NPS is calculated by subtracting the percentage of Detractors from the percentage of Promoters.
NPS = % Promoters – % Detractors
If a company has 100 responses with 70 Promoters and 10 Detractors, NPS would be:
NPS = (70 – 10) = 60
An NPS of 60 is considered good, indicating that the majority of customers are loyal and likely to recommend the company. This score can guide the company in leveraging positive customer relationships and addressing the concerns of Detractors to improve overall satisfaction.
3. Customer Effort Score (CES)
Customer Effort Score (CES) measures the ease with which customers can get their issues resolved or interact with a company’s service. It assesses the effort required from customers to achieve their desired outcome during interactions with the company.
CES is critical for businesses as it helps identify how easy it is for customers to use their products or services. A low effort score suggests a smooth customer experience, leading to higher satisfaction and loyalty. Improving CES can significantly impact customer retention, as customers are more likely to continue using services that are easy and convenient.
How to calculate:
CES is typically measured by asking customers to rate the ease of their experience on a scale and then averaging these ratings.
CES = Sum of all individual effort scores / Total number of responses
Suppose a company conducts a CES survey and receives an average score of 3 on a 5-point scale (with 5 being very easy). In that case, it indicates that customers find the company’s services reasonably effortless to use. However, there is room to make processes more seamless and reduce customer effort further.
4. Customer Acquisition Cost (CAC)
Customer Acquisition Cost (CAC) quantifies the total expense incurred to acquire a new customer, including all marketing and sales efforts. It’s a critical metric for understanding the investment required to expand the customer base and is fundamental for evaluating the efficiency of acquisition strategies and overall business sustainability.
CAC is crucial for businesses as it helps determine the profitability of acquiring new customers and guides budget allocation for marketing and sales. A lower CAC indicates a cost-effective acquisition strategy, allowing businesses to grow their customer base without eroding profit margins. Analyzing CAC in conjunction with customer lifetime value (CLV) provides insights into return on investment (ROI) and long-term business viability.
How to calculate:
The calculation of CAC involves dividing the total cost of acquiring new customers by the total number of consumers acquired in the same period. Here is the formula:
CAC = Total Acquisition Costs / Total Number of New Customers Acquired
If a company spends $100,000 on marketing and sales in a year and acquires 1,000 new customers, the CAC would be:
CAC = $100,000 / 1,000 = $100 per customer
A CAC of $100 means that the company spends $100 to acquire each new customer. This figure helps the company assess the efficiency of its acquisition strategies and optimize its spending to improve ROI.
5. Churn Rate
Churn Rate measures the percentage of customers who stop using a company’s products or services within a given period. It is a critical indicator of customer retention and satisfaction, reflecting the company’s ability to maintain its customer base over time.
Understanding the Churn Rate is vital for businesses to identify customer retention issues and the underlying reasons for churn. A high Churn Rate can signal problems with the product or service, customer support, or overall customer experience. Reducing churn is essential for maintaining revenue stability and improving customer lifetime value.
How to calculate:
To compute the Churn Rate, tally the customers who discontinued service within a specified timeframe and divide this by the customer count at the period’s start.
Churn Rate = (Number of Customers Lost / Number of Customers at Start of Period) × 100
If a company starts the quarter with 500 customers and loses 50 by the end of the quarter, the Churn Rate is:
Churn Rate = (50 / 500) × 100 = 10%
A 10% Churn Rate indicates that the company lost 10% of its customer base in that quarter. This metric prompts the company to investigate the reasons for customer departures and develop strategies to improve retention.
6. Customer Lifetime Value (CLV)
Customer Lifetime Value (CLV) is the total revenue a company can expect from a customer throughout their relationship. It’s a forecast of the net profit attributed to the entire future relationship with a customer and is pivotal in strategizing marketing, sales, and customer service.
Related read: How to increase customer lifetime value: 10 Effective ways
CLV is vital because it helps businesses understand the long-term value of customers and determine how much they should invest in retaining and acquiring them. A higher CLV suggests that customers are more valuable over time, which can justify increased spending on customer retention efforts. It also helps prioritize resources toward the most profitable customer segments.
How to calculate:
CLV is calculated by multiplying the average purchase value by the average purchase frequency rate and then multiplying the result by the average customer lifespan.
CLV = Average Purchase Value × Purchase Frequency × Average Customer Lifespan
If the average purchase value is $50, the average purchase frequency is twice a year, and the average customer lifespan is 5 years, the CLV would be:
CLV = $50 × 2 × 5 = $500
It means that, on average, a customer is worth $500 to the company in terms of their relationship. Understanding CLV helps in making informed decisions about how much money to invest in acquiring and retaining customers to ensure profitable growth.
7. Customer Retention Rate (CRR)
Customer Retention Rate (CRR) quantifies the proportion of consumers that a business manages to keep over a given timeframe. This metric serves as a pivotal gauge of customer loyalty and contentment, shedding light on the success of strategies aimed at retaining customers and the intrinsic value derived from the company’s offerings.
CRR is crucial for businesses as it highlights the success of customer engagement and satisfaction efforts. A high retention rate indicates that customers are satisfied and continue to find value, contributing to stable revenue and growth. It also helps businesses identify successful practices and areas for improvement in customer relationships.
Related read: How to retain customers: 15 strategies to improve customer retention
How to calculate:
To compute CRR, initiate by deducting the quantity of newly acquired customers within the period from the total customer count at the period’s end. Then, divide this result by the customer count at the period’s commencement and escalate the outcome by 100 to express it as a percentage.
CRR = ((Number of Customers at End of Period – New Customers during Period) / Number of Customers at Start of Period) × 100
If a company starts with 200 customers, ends with 230 customers, and acquires 50 new customers during the period, its CRR is:
CRR = ((230 – 50) / 200) × 100 = 90%
A CRR of 90% means the company retained 90% of its customer base, which indicates strong customer loyalty and effective retention strategies.
8. Monthly Recurring Revenue (MRR) and Annual Recurring Revenue (ARR)
Monthly Recurring Revenue (MRR) and Annual Recurring Revenue (ARR) are metrics that represent the predictable and consistent revenue generated from customers on a monthly and annual basis, respectively. They are crucial for subscription-based businesses to gauge financial health and growth trajectory.
MRR and ARR provide insight into the stability and growth of revenue streams, helping businesses make informed decisions on budgeting, forecasting, and resource allocation. Consistent MRR and ARR growth indicate a healthy, expanding customer base and effective monetization strategies.
How to calculate:
MRR is the total monthly revenue from all active subscriptions. ARR is typically MRR multiplied by 12.
MRR = Sum of All Monthly Subscription Revenues
ARR = MRR × 12
If a company has 100 customers, each paying a monthly subscription of $100, then MRR is:
MRR = 100 × $100 = $10,000
To calculate ARR, multiply MRR by 12:
ARR = $10,000 × 12 = $120,000
An MRR of $10,000 and an ARR of $120,000 indicate steady revenue, allowing the business to plan long-term strategies confidently.
9. Expansion Revenue
Expansion Revenue measures the additional revenue generated from existing customers through upselling or cross-selling. It is indicative of the ability to grow revenue within the existing customer base and reflects customer satisfaction and product value.
Tracking Expansion Revenue is essential for businesses to understand the effectiveness of upselling and cross-selling strategies and to gauge customer loyalty and product adoption. Increased Expansion Revenue suggests that customers find additional value in the offerings, leading to enhanced customer lifetime value.
How to calculate:
Expansion Revenue is calculated by summing all additional revenues from upsells and cross-sells to existing customers during a specific period.
Expansion Revenue = Total Revenue from Upsells and Cross-sells
If a company generates $5,000 from upselling and $3,000 from cross-selling in a month, the Expansion Revenue is:
Expansion Revenue = $5,000 + $3,000 = $8,000
It indicates successful engagement and satisfaction among current customers, highlighting the potential for revenue growth within the existing customer base.
10. Customer Health Score
The Customer Health Score is a composite metric that assesses the overall health and potential longevity of a customer relationship. It combines various indicators, such as product usage, customer feedback, support interaction frequency, and payment history, to gauge a customer’s engagement and satisfaction levels.
Understanding the Customer Health Score helps businesses identify which customers are thriving and which may be at risk of churning. It allows for proactive engagement and targeted strategies to improve customer experiences, enhance satisfaction, and ultimately retain valuable customers.
How to calculate:
The Customer Health Score is typically calculated by aggregating and weighting different customer engagement and satisfaction metrics tailored to the specific business model and goals.
Customer Health Score = Sum of (Weight × Metric Score) across all selected metrics
If a business considers product usage, support tickets, and payment timeliness as metrics with respective weights of 50%, 30%, and 20%, and a customer scores 8, 7, and 9 on these metrics (out of 10), then:
Customer Health Score = (0.5 × 8) + (0.3 × 7) + (0.2 × 9) = 7.9
A score of 7.9 suggests a healthy customer relationship, indicating high engagement and satisfaction levels. Businesses can use this score to segment customers, tailor engagement strategies, and prioritize resource allocation.
11. Time to First Value (TTFV)
Time to First Value (TTFV) measures the duration it takes for a customer to realize significant value from a product or service after purchase. This metric is crucial in evaluating the effectiveness of the onboarding process and the immediate impact of the product on the customer.
A shorter TTFV often correlates with higher customer satisfaction and loyalty, as customers who quickly see value are more likely to continue using the product. It also helps businesses refine their onboarding process and product offerings to ensure rapid value delivery.
How to calculate:
TTFV is calculated from the moment a customer signs up or makes a purchase until they achieve a predefined success milestone.
TTFV = Time at Success Milestone – Time of Purchase
If a customer purchases software and completes their first project setup within 4 days, then:
TTFV = 4 days
A TTFV of 4 days indicates an effective onboarding process and immediate product value realization. Businesses can strive to minimize TTFV to enhance customer experiences and satisfaction from the outset.
12. Average Resolution Time
Average Resolution Time is the average duration taken to resolve customer issues or inquiries. It is a crucial indicator of the efficiency and responsiveness of the customer support team.
Tracking and optimizing Average Resolution Time is essential for maintaining high levels of customer satisfaction and loyalty. It reflects the company’s commitment to addressing customer needs promptly and efficiently.
How to calculate:
This metric is calculated by dividing the total time taken to resolve all support inquiries by the number of inquiries resolved.
Average Resolution Time = Total Time Taken to Resolve Issues / Number of Issues Resolved
If a support team resolves 100 inquiries in 200 hours, then:
Average Resolution Time = 200 hours / 100 inquiries = 2 hours per inquiry
An average resolution time of 2 hours signifies a swift response to customer needs, likely contributing to positive customer experiences and high satisfaction levels.
13. Renewal Rate
Renewal Rate measures the percentage of customers who choose to renew their service or product subscription after the initial contract period. This metric is critical for assessing customer loyalty and the long-term value of customer relationships.
A high Renewal Rate indicates strong customer satisfaction and product or service value, signifying a successful customer retention strategy. It helps businesses forecast revenue stability and identify areas for improving customer experience.
How to calculate:
To determine the Renewal Rate, assess the ratio of customers who opt to continue their service against those eligible for renewal in the given period. This metric offers insights into the enduring value and satisfaction your service provides.
Renewal Rate = (Number of Customers Renewed / Number of Customers Up for Renewal) × 100
If 150 out of 200 customers renew their subscriptions, the Renewal Rate is:
Renewal Rate = (150 / 200) × 100 = 75%
A 75% renewal rate suggests good customer retention, but there is also room for improvement. Businesses can analyze the reasons for non-renewals to enhance customer satisfaction and increase this rate.
14. Onboarding Success Rate
The onboarding Success Rate quantifies the percentage of new customers who successfully complete the onboarding process, indicating how well a business integrates new customers into using its products or services.
An effective onboarding process is crucial for customer satisfaction, retention, and long-term success. A high onboarding success rate means that new customers find value quickly, reducing the likelihood of churn.
How to calculate:
The Onboarding Success Rate is gauged by analyzing the proportion of new customers who navigate through the onboarding journey successfully against the total newcomers in the same timeframe. This indicator sheds light on the effectiveness of the onboarding experience.
Onboarding Success Rate = (Number of Customers Who Complete Onboarding / Total Number of New Customers) × 100
If 200 new customers start the onboarding process and 160 complete it successfully, the Onboarding Success Rate is:
Onboarding Success Rate = (160 / 200) × 100 = 80%
An 80% Onboarding Success Rate is robust. It indicates effective onboarding practices. Companies can aim to increase this rate by identifying and addressing hurdles in the onboarding journey.
15. Product Adoption Rate
Product Adoption Rate measures the extent to which customers use and integrate a product into their workflows, reflecting the value and usability of the product.
Understanding Product Adoption Rate helps businesses gauge how well their product meets customer needs and identifies opportunities to enhance product features, training, and support to increase usage.
How to calculate:
To compute the Product Adoption Rate, examine the percentage of users actively engaging with the product compared to the total user base. This metric reflects the product’s ability to become an integral part of the users’ operational routine.
Product Adoption Rate = (Number of Active Users / Total Number of Users) × 100
If a software has 1000 users, and 700 are actively using it, the Product Adoption Rate is:
Product Adoption Rate = (700 / 1000) × 100 = 70%
A 70% Product Adoption Rate indicates a strong engagement level, suggesting that most users find the product valuable. Businesses can further investigate to understand why the remaining 30% are not actively using the product and develop strategies to increase engagement.
16. Support Ticket Trends
Support Ticket Trends analyze the patterns and frequencies of customer support inquiries, providing insights into common issues, customer pain points, and the effectiveness of the support team.
Understanding these trends helps businesses identify areas for improvement in their product or service and optimize their customer support strategy. By monitoring ticket volumes, types, and resolution times, companies can enhance customer satisfaction and reduce future support requests.
How to calculate:
While there is no single formula, companies typically analyze the number of tickets raised over time, categorize them by type or issue, and track resolution metrics.
If a company notices a consistent increase in tickets related to a specific feature, it may indicate a broader issue with that feature’s usability or functionality. For example, suppose ticket volume for billing issues spikes after a new billing system is implemented. In that case, it suggests that customers are struggling with the change and that additional support or user education is needed.
17. Revenue Churn
Revenue Churn measures the loss of revenue over a specific period due to customer cancellations or downgrades. It is a vital metric for understanding the financial impact of customer turnover.
Tracking Revenue Churn helps businesses quantify the financial loss associated with lost customers and identify trends in customer behavior. By understanding revenue loss patterns, companies can implement targeted strategies to improve customer retention and minimize revenue leakage.
How to calculate:
Revenue Churn is calculated by dividing the total lost revenue from cancellations and downgrades by the total revenue at the start of the period.
Revenue Churn = (Lost Revenue from Cancellations and Downgrades / Total Revenue at Start of Period) × 100
If a company starts with $100,000 in revenue and loses $10,000 due to cancellations and downgrades, the Revenue Churn is:
Revenue Churn = ($10,000 / $100,000) × 100 = 10%
A 10% Revenue Churn indicates that the company is losing a significant portion of its revenue to churn. It highlights the need for improved customer retention strategies and a deeper analysis of the causes behind cancellations and downgrades.
The final thoughts
As the dust settles on the expansive landscape of customer success metrics, it’s clear that the future beckons with a promise of more nuanced and sophisticated strategies. In this ever-evolving terrain, businesses must not only measure success but also predict and shape it. Enter the realm of advanced solutions like Yellow.ai, where the fusion of AI-driven analytics and human insight paves the way for a new era of customer engagement. By leveraging Yellow.ai’s predictive analytics and dynamic customer engagement tools, companies can transcend traditional metrics, anticipating customer needs and crafting experiences that resonate on a deeper level.
In this journey of continuous improvement and customer delight, the path is illuminated by the insights garnered from these 17 metrics. Yet, the true compass guiding this voyage is the innovative spirit of solutions like Yellow.ai. With its ability to integrate seamlessly into your customer success framework, Yellow.ai not only helps in monitoring and analyzing these metrics but also in acting upon them proactively. By harnessing the power of such advanced technologies, businesses can ensure that their voyage through the customer success galaxy is not just reactive but also visionary, charting courses to stellar customer satisfaction and beyond.
Frequently asked questions (FAQs)
How do you measure customer success?
Measuring customer success involves a comprehensive approach, utilizing a suite of metrics to gauge various aspects of the customer experience. Tools and methodologies range from direct feedback instruments like CSAT and NPS surveys to analytical measures such as churn rate and customer lifetime value (CLV). The integration of these metrics provides a holistic view of customer engagement and satisfaction, guiding businesses in refining their strategies and operations for enhanced customer success.
Why is it important to track customer success metrics?
Tracking customer success metrics is pivotal for businesses to understand the efficacy of their services and products from the customer’s perspective. These metrics illuminate the strengths and weaknesses in the customer journey, offering data-driven insights that drive improvements in product development, customer service, and overall experience. They serve as a compass for navigating customer needs and expectations, ensuring sustained business growth and customer loyalty.
What is the most important metric for customer success?
Identifying the most important metric for customer success can vary depending on business objectives and industry norms. However, the Net Promoter Score (NPS) often stands out for its broad reflection of customer loyalty and propensity to advocate for the brand. It provides a snapshot of customer sentiment and engagement, serving as a catalyst for broader strategic initiatives aimed at enhancing customer satisfaction and driving business growth.
What are the KPIs for a customer success manager?
A customer success manager’s KPIs encompass metrics that directly reflect the health and success of customer relationships. These include renewal rates, churn rates, customer satisfaction scores (CSAT), net promoter scores (NPS), and customer effort scores (CES). Additionally, performance indicators like onboarding effectiveness, product adoption rates, and customer engagement levels are crucial for assessing the impact of customer success initiatives and aligning them with the overall business strategy.