


Executive summary
Help desk metrics emerge as the ultimate navigators towards customer service excellence. As customer expectations soar, with a staggering 58% demanding unparalleled service and around 84% expecting their issues to be resolved swiftly and accurately, these metrics transform your help desk into a powerhouse of efficiency and customer satisfaction. Arm yourself, wielding the power to explore hidden insights, pinpoint improvement areas, and leave your customers more than just satisfied.
This blog is your quintessential guide through the top 11 help desk metrics, from ticket volume trends to customer satisfaction ratings and beyond. But it’s not merely about understanding these metrics; it teaches you how to employ them to revolutionize your operations. Why invest your time here? Because mastering these metrics is no longer optional—it’s critical. Staying ahead means turning data into action as customer service standards and expectations evolve. Let’s move towards transforming your help desk into a well-oiled customer satisfaction machine, where every metric is a step towards operational excellence and unrivaled customer delight.
Related must-reads:
- Help desk automation: Benefits, features and types
- The 10 best help desk software of 2024
- Help desk ticketing system: Best practices for businesses
What is a help desk?
Consider that the help desk is an efficient apparatus; for exceptional client service, every part must be in peak operating condition. Often, the help desk works as the first point of contact for your customers and employees. It is the go-to place for customers when they need answers. A customer service help desk focuses on the external customer, who may have questions or problems with the items or services offered.
Which help desk metrics should your service team track?
Your service team must understand suitable help desk metrics to track them. This is crucial to improve customer support and operational efficiency. Help desk metrics empower you to make informed decisions driven by data, striving to better customer satisfaction and optimize processes. The help desk metrics a service team should monitor for optimal performance are listed below.
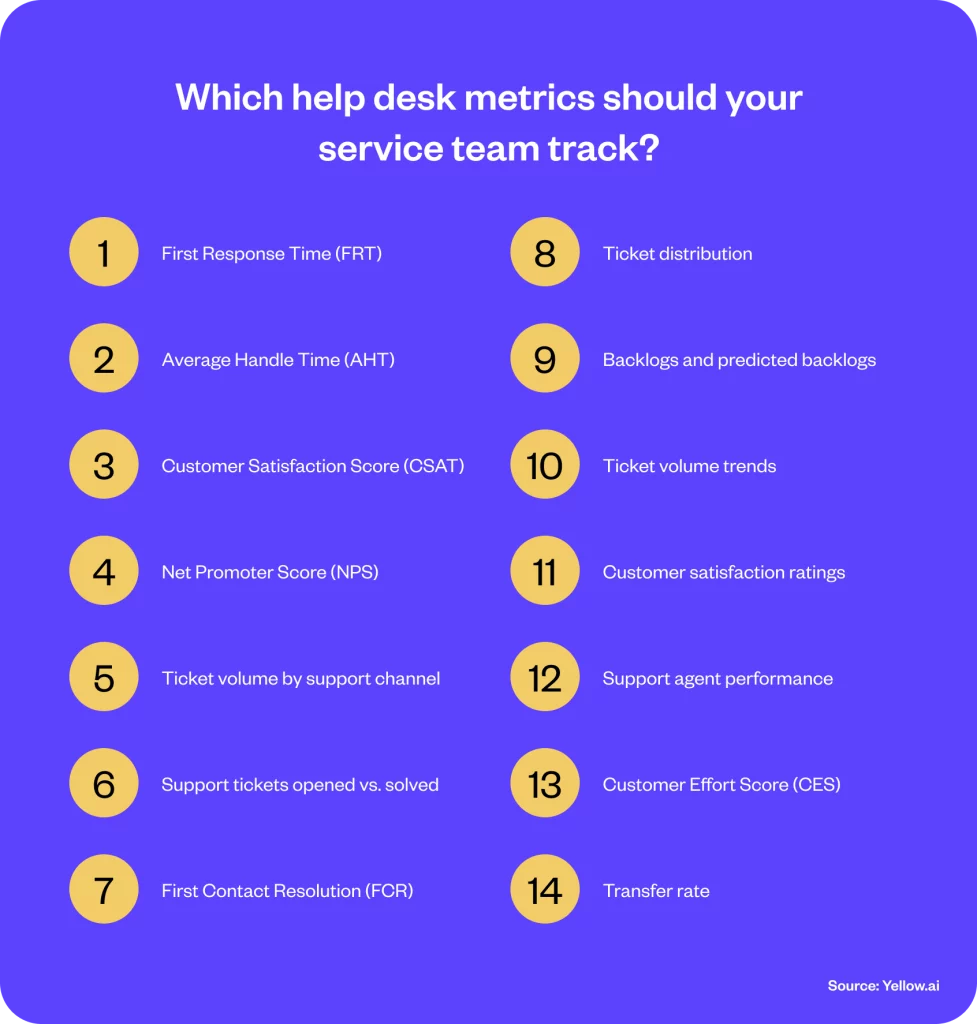
- First Response Time (FRT): Measures the speed at which customers receive an initial response to their support requests.
- Average Handle Time (AHT): Calculates the average duration taken to resolve customer issues, from start to finish.
- Customer Satisfaction Score (CSAT): Gauges customer satisfaction level with each support interaction.
- Net Promoter Score (NPS): Assesses the likelihood of customers recommending your service to others.
- Ticket volume by support channel: Tracks the number of tickets received across different channels, helping to allocate resources effectively.
- Support tickets opened vs. solved: A comparison of the number of new tickets to the number resolved within a specific period, indicating the workload and efficiency.
- First Contact Resolution (FCR): Monitors the percentage of issues that are successfully resolved during the client’s first point of contact.
- Ticket distribution: Reveals how tickets are allocated among categories, issues, or departments, showing areas of substantial interest.
- Backlogs and predicted backlogs: Track current unresolved ticket volume and forecasts based on trend analysis.
- Ticket volume trends: Analyzes the number of support tickets received over a certain period, helping to identify patterns and peak periods.
- Customer satisfaction ratings: Aggregated customer feedback scores provide a broad measure of support success.
- Support agent performance: Evaluation of individual agent efficiency and effectiveness, based on resolution rates and customer feedback.
- Customer Effort Score (CES): Measures how much effort customers have to place for getting their issues resolved.
- Transfer rate: The frequency with which tickets are transferred between agents or departments, an indicator of process efficiency and specialization.
What are help desk metrics and KPIs?
Consider help desk metrics as the compass guiding your customer service team. These are measurable stats that reveal how well your team tackles issues and keeps customers pleased. A help desk KPI is a performance metric circling your business’s customer support and service activities. The specific metrics you track can vary – an IT help desk might focus on resolution times, while a customer service team might prioritize satisfaction scores. No matter the focus, these metrics are tools for identifying improvement areas and ensuring your customers are raving fans!
Why is it important to measure help desk metrics?
Measuring help desk metrics is important as it allows one to discern and better the customer support experience. These metrics give insights into customer satisfaction, operational efficiency, and agent performance, allowing for targeted revisions in service quality. Tracking metrics like CSAT, NPS, and Average Handle Time helps identify areas where your support team excels and where there is room for upgrade, ensuring that customer needs are met quickly and precisely.
Furthermore, help desk metrics inform strategic decisions and promote a culture of continuous upgrading within organizations. Regularly measuring and analyzing these metrics is essential for maintaining high customer service standards and driving business growth.
Benefits of tracking help desk metrics
Let’s list down the 7 benefits of measuring help desk metrics.
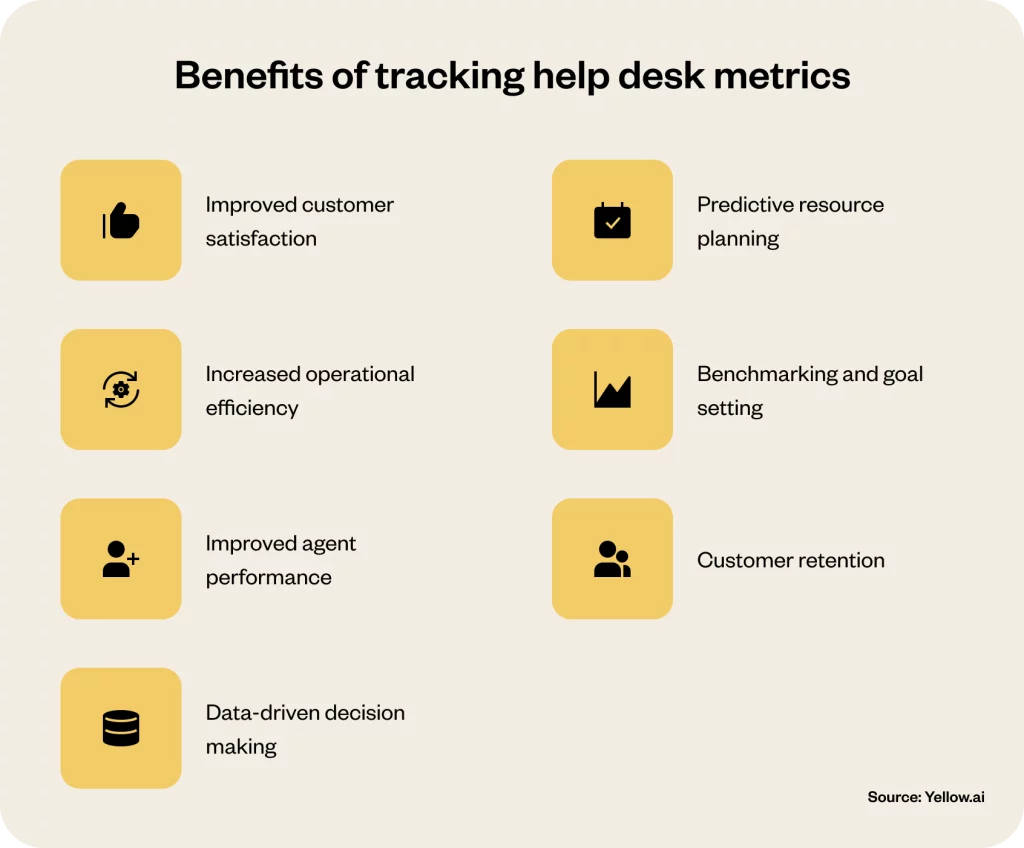
- Improved customer satisfaction
CSAT and NPS measurements show how satisfied consumers are with their assistance. This input helps alter services quickly, increasing customer delight and loyalty.
- Increased operational efficiency
Utilizing indicators like AHT and FRT will help you discover support process bottlenecks and optimize operations, lowering costs and boosting productivity.
- Improved agent performance
Measuring agent metrics like resolution rates and customer feedback helps identify training requirements and recognize top performers, enhancing team efficiency and morale.
- Data-driven decision making
Help desk metrics may inform strategic personnel, tool, and process decisions to maximize effectiveness.
- Predictive resource planning
Trends in ticket volume and backlog projections help predict busy periods and schedule enough people, minimizing fatigue and preserving service quality.
- Benchmarking and goal setting
Measuring help desk metrics regularly helps teams define realistic performance benchmarks and goals for ongoing development and responsibility.
- Customer retention
Monitoring and acting on support desk data may enhance customer experience and develop long-term connections.
Related read: Customer Retention: 15 Strategies to Improve CR
Top 11 help desk metrics to measure in 2024
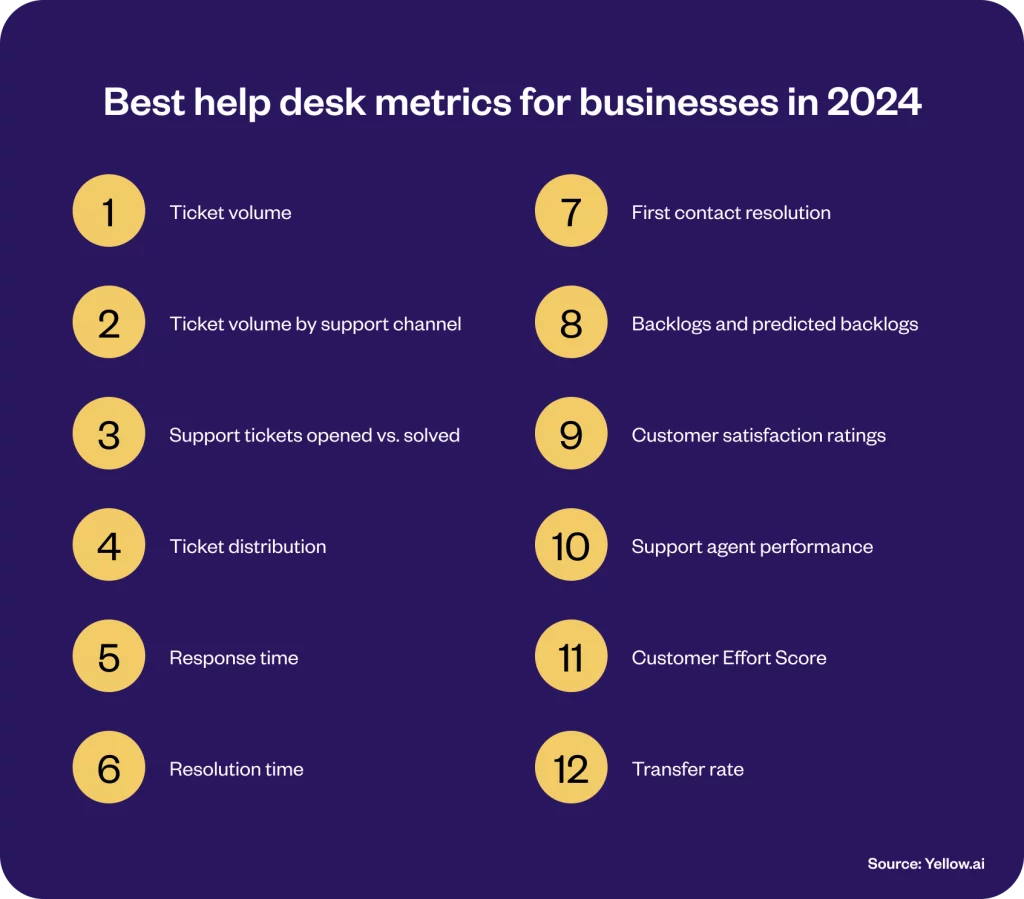
As we have learned so far there are several help desk metrics. However, in 2024, you must focus on the following best 11 help desk metrics and let your business use them to measure various aspects.
Best help desk metrics for businesses in 2024
- Ticket volume
- Ticket volume by support channel
- Support tickets opened vs. solved
- Ticket distribution
- Response time
- Resolution time
- First contact resolution
- Backlogs and predicted backlogs
- Customer satisfaction ratings
- Support agent performance
- Customer Effort Score
- Transfer rate
1. Ticket volume
Ticket volume measures the total number of support tickets submitted over an explicit period, reflecting the rate of customer issues. This metric goes beyond just recognizing areas for better self-service options, like a knowledge base. It also helps you predict how many support heroes you’ll need on deck. You can spot trends and prepare for times when more tickets roll in by keeping an eye on average ticket volume.
How to measure it: Count the total number of support tickets submitted daily, weekly, monthly, quarterly, or annually. Tracking across different time frames offers a comprehensive view, enabling trend identification and effective staff forecasting.
2. Ticket volume by support channel
Ticket volume by support channel breaks down the total number of tickets based on how customers contact your support team—via email, phone, chat, or social media. According to a Garner poll, 93% of respondents said they were very satisfied when customers were able to smoothly switch between channels. This differentiation is vital for understanding customer preferences and optimizing each support channel for efficiency and satisfaction. It also highlights areas where additional resources or improvements are needed to meet demand effectively. This insight allows for strategically allocating service efforts including automating a few channels to enhance customer experience.
How to measure it: Compile the total number of tickets for each support channel during your chosen time frame. Analyzing this data helps pinpoint which channels are most favored by your customers and may require additional attention or properties.
3. Support tickets opened vs. solved
It clearly shows your help desk’s efficiency in resolving customer issues. By comparing the number of tickets created to those successfully resolved within a specific period, this metric highlights the effectiveness of your support team and identifies any gaps in the resolution process. It’s essential to ensure that your team keeps pace with incoming requests and maintains a high level of customer satisfaction.
How to measure it: Compute the sum of all tickets resolved by your team within a particular time period. Match that to the number of tickets your team opened in that timeframe.
4. Ticket distribution
This help desk metric measures how support requests are spread across different categories or issues, providing insight into customers’ most common challenges. This metric is crucial for identifying high-demand areas requiring more attention or resources. By understanding ticket distribution, support teams can prioritize efforts, tailor their training programs, and adjust their resource allocation to effectively address the highest pressing customer needs.
How to measure it: Categorize each ticket by issue type or category during your selected period. Then, calculate the percentage of total tickets each category represents.
5. Response time
This vital help desk metric tracks how quickly your support team replies to a customer’s initial inquiry. This measure directly impacts customer satisfaction, as faster responses often correlate with greater customer happiness and trust. Higher response times indicate concerns like agents not knowing what they’re working on or lacking skills in managing their workload.
How to measure it: Calculate the average time taken from when a ticket is submitted to when the support team gives the first response. This can be measured in minutes, hours, or days, depending on your service level agreements (SLAs) and goals.
6. Resolution time
It calculates the duration from when a customer support ticket is opened until it is resolved and closed. This metric is paramount for assessing the efficiency and effectiveness of your support team’s problem-solving capabilities. Average resolution times can help discover anomalies and serious difficulties. An unusually long ticket resolution time may signal a problem.
How to measure it: Calculate the length of time between when a support ticket is submitted and when an agent marks it as resolved.
7. First contact resolution
It quantifies the percentage of support tickets resolved during the first interaction with the customer. High FCR rates indicate a support team’s ability to efficiently address and solve customer issues without needing back-and-forth interactions, follow-ups, or escalations. It evaluates your support team’s efficiency. It also gauges the overall customer experience, as resolving problems quickly and in a single interaction leads to greater customer satisfaction and loyalty.
Related read: First contact resolution (FCR): Benefits + how to improve
How to measure it: Count the total number of cases resolved during the first contact and divide it by the entire number of support tickets during that period.
8. Backlogs and predicted backlogs
Backlogs tell you how many tickets haven’t been solved yet, while predicted backlogs use trends to guess what’s coming next. It helps you see if your team can handle the workload and avoid frustrating delays. Predicted backlog prepares you to proactively tackle existing backlogs, adjust staffing, or even invest in self-service options like a knowledge base. By planning based on backlogs, you keep your customers happy and your support team afloat!
How to measure it: Count the current number of unresolved tickets (backlog) and use historical data on ticket closure rates and incoming ticket volumes to estimate future backlogs (predicted backlogs).
8. Customer satisfaction ratings
Happy customers are loyal customers! Customer satisfaction rating is a key metric. Tools like CSAT surveys, sent after a support interaction, give you a direct pulse on how well you’re meeting their needs. High scores mean happier customers, while low scores pinpoint areas for improvement. This goes beyond just resolving tickets quickly – it’s about exceeding expectations and building lasting allegiance. Among support staff, 41% rank CSAT as the most important key performance indicator for their team. For a broader view, consider the Net Promoter Score (NPS). This metric asks how likely customers are to recommend your company, giving you an overall sense of customer loyalty.
Related read: 55 Customer satisfaction survey questions to ask
How to measure it: Customers ought to rate their happiness from 1 (extremely upset) to 5 (very delighted). Divide the total number of poll responses by the number of happy people (those who gave the poll a 4 or 5).
10. Support agent performance
Tracking agent performance isn’t just about finding top performers. It also reveals areas where agents might need extra training or support. This lets you tailor your resources and match agent strengths to specific channels – like email or chat – where ticket volume is high. Content, empowered agents are more productive and deliver exceptional service, building customer loyalty and keeping those satisfaction scores soaring!
How to measure it: Compute the duration of designated tasks an agent completes and divide the resulting figure by the overall duration of their shift. For the percentage, multiply by 100.
11. Customer Effort Score
As a metric, CES measures the ease with which customers can resolve their issues using your support services. A low effort score suggests a smooth and efficient customer experience, leading to higher satisfaction. Tracking CES helps uncover support process bottlenecks and streamline remedies, improving customer experience.
Related read: What is Customer Effort Score and how to improve CES?
How to measure it: Ask customers how easy it was to resolve their issue (1-5 scale). High scores mean happy customers, low scores indicate frustration. The average number may be calculated from all survey replies.
12. Transfer rate
This metric quantifies the frequency at which customer support tickets are transferred from one agent or department to another before resolution. A lower transfer rate indicates a more streamlined and efficient support process where the initial point of contact quickly resolves issues. By monitoring this help desk metric, you can identify opportunities for reducing unnecessary transfers, thereby improving resolution times and customer satisfaction.
How to measure it: Determine the percentage of tickets that need several transfers before resolution. For example, if you have 100 tickets and 20 of them were transferred at least once, the transfer rate would be 20%.
How Yellow.ai assists you to track and measure help desk metrics?
Today’s aware, sensitized and demanding customers need swift and accurate yet empathetic resolution of their problems or service requests. For businesses aiming to excel in customer service to achieve heightened customer satisfaction and loyalty without taxing their human resource or adding cost, Yellow.ai emerges as the one-stop solution. It is a pioneer in extending advanced automation powered by first-of-its-kind artificial intelligence. Like many leading brands from across the sectors, you can partner with Yellow.ai to track help desk metrics and address the areas of improvement.
- Win customer satisfaction rating through empathy
Now, experience the power of automation with human-like empathy to achieve higher customer satisfaction. Use our Sentiment Analysis, which senses the customers’ emotions during an interaction. It echoes that the customer is heard, understood and valued.
- Improve transfer rate score with cohesive interaction summaries
Our AI-powered tools and solutions work as the first-line of contact to resolve simple queries
or issues in automated customer service. The smart AI transfers the conversation summaries and related context for complex situations to the human agents. Quicker information collection helps agents address issues faster and reduce transfer rate. Meanwhile, it assures clients that they needn’t repeat themselves.
- Track ticket volume by support channel through omnichannel automation
Yellow.ai omnichannel automation gives businesses the advantage to extend customer service across 35+ channels. Be it WhatsApp, X, telephone, live chat or email. It also helps to keep a track of ticket volume across these channels and fix the loose ends. Our latest innovation, LLM powered Email Automation has enhanced seamless automated response to inbound customer emails by 80%.
- Speed up resolution time with prompt and quick response
Our AI driven automation collects permissible data, customer journey map tracking previous interaction to preferences. Thus, when a customer connects to your help desk, you can witness a drastic speed in resolution time. This extensive database and its instantaneous access let you answer client questions swiftly and accurately, optimizing resolution and minimizing client wait time.
Hyundai provides swifter response with Yellow.ai automation

- Master minimizing predicted backlog with text automation
Our multi-LLM-based Dynamic Automation Platform lets you offer instant, on-demand query responses to consumers with 0% wait periods utilizing dynamic AI agents. In 30 days, automate 90% of client queries. It works wonders while using the predicted backlog metric.
Want to master the skill of measuring and tracking best help desk metrics in 2024? Book a demo with Yellow.ai.
Conclusion
Leveraging help desk metrics has become increasingly crucial for businesses aiming to excel in customer service. There is a growing awareness about the value these metrics bring in understanding customer needs and refining service delivery. Organizations gain a clearer picture of their service efficiency and customer expectations by tracking crucial help desk metrics such as ticket volume, Customer Effort Score, resolution time, and customer satisfaction ratings. They can also augment the efficiency of support agents.
Data-driven strategies help organizations make better decisions, identify areas for upgrading, manage resources, expedite assistance, and boost customer experience. We’ve discovered, tracking help desk metrics promotes continual improvement and customer-centricity beyond number-crunching. In 2024, using these metrics to maximize your help desk’s performance and give consumers fast, effective service is ideal.