


The Ultimate Guide to Customer Service KPIs for Exceptional Support
Customer service key performance indicators have emerged as significant gamechangers for businesses worldwide. The success or downfall of a business hinges on the depth of its connections with consumers. To ensure impactful customer service (CS) encounters, meticulous measurement of key performance indicators (KPIs) is imperative. This blog delves into unraveling your support strategy, enhancing customer satisfaction, and addressing pivotal CS KPIs. By vigilantly tracking these metrics, businesses can pinpoint areas for enhancement, ultimately optimizing their CS operations. Explore as we delve into critical examples of customer service KPIs like average resolution time, customer happiness score, and initial response time, providing insights on tracking and optimizing them for enhanced CS efficiency.
Why are customer service KPIs important?
Customer service KPIs are essential, providing insight into how businesses genuinely connect with customers. While a company may perceive its service as top-notch, 70% of consumers base choices on exceptional customer service. According to a report on client expectations, poor customer service costs companies billions in sales annually as customers switch brands. A 2022 survey said, 50% of U.S. customers think COVID-19 has made them prioritize customer service during brand selection. Metrics offer unbiased evaluations, highlighting success areas and improvement needs.
Introducing customer service KPIs equips you with data analytics to make informed decisions, bridging gaps for significant and sustainable success. For support teams, meeting modern expectations is crucial in influencing buying decisions. One poor customer support experience can lead to a customer and revenue loss. Monitoring specific KPIs ensures ongoing performance assessment, aiding process adjustments and agent training optimization for a direct impact on the company’s bottom line.
Top customer support KPIs: Metrics that matter for team success
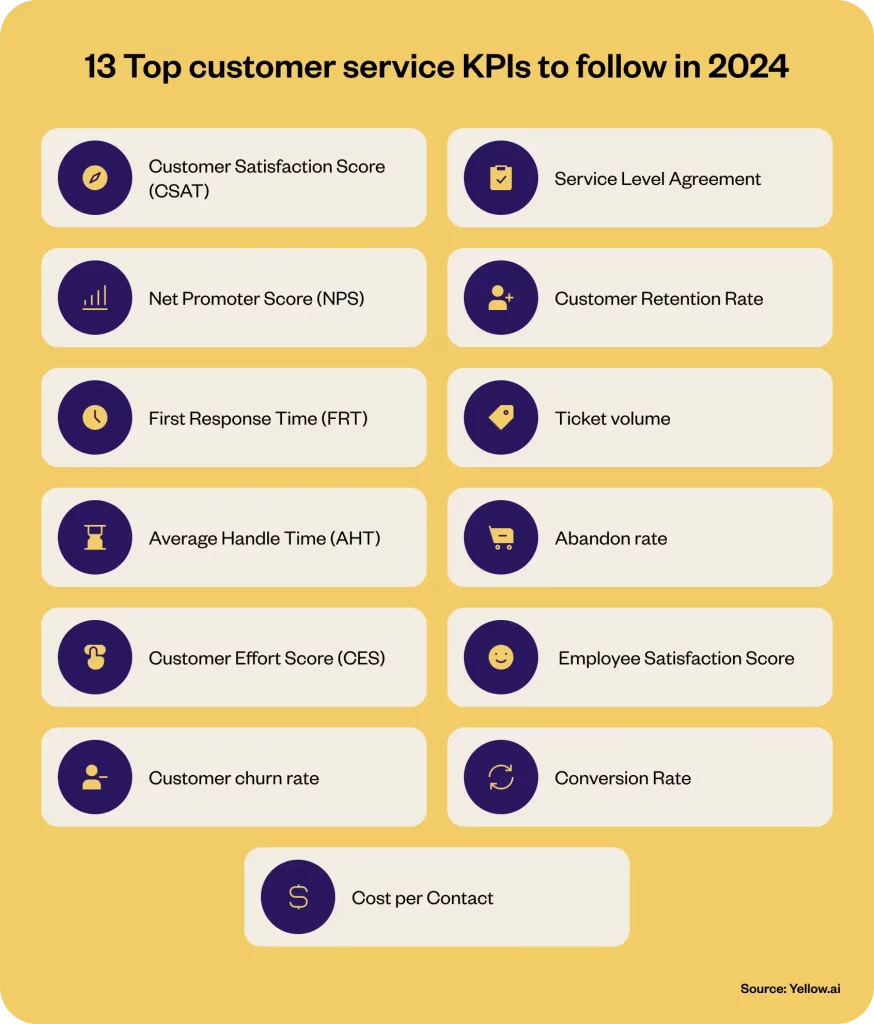
As the customer service sector is evolving to meet the ever-growing expectations of customers from business providers, it has become more than essential to have tools to measure one’s success in this particular domain. Around 80% of consumers move to your rival brand after one or more adverse encounters, according to a Zendesk report. It is a must to keep CS at its best. Let’s learn about the 13 most important KPIs businesses must consider implementing in customer service to improve performance.
KPI #1. Customer Satisfaction Score (CSAT)
Customer Satisfaction Score (CSAT) also referred to as happy customer KPI is a pivotal metric reflecting customers’ happiness post-support interactions. After engaging with support staff, customers provide feedback through surveys, quantifying their satisfaction level. Studies affirm that higher CSAT correlates with improved retention and reduced churn. Conducting CSAT surveys, utilizing tools like Survey or Simplesat, gauges sentiment and gathers qualitative insights. Encouraging customers to share comments unveils specific areas for improvement. The straightforward CSAT question, rated on a scale, offers a quick snapshot of the customer experience.
Analyzing low scores unveils procedural gaps, prompting updates and additional agent training. Patterns may emerge, linking higher CSAT with top-performing agents and guiding optimization for enhanced customer satisfaction and loyalty. CSAT is a powerful tool that delivers actionable insights for refining customer service strategies.
Example: If you are an online grocery delivery store, you can use CSAT and using emojis can ask:
- Are you fully satisfied?
- Needs improvement
- Poor experience
KPI #2. Net Promoter Score (NPS)
For customer service teams, NPS as a KPI is gold. Analyzing responses reveals what makes customers smile (think lightning-fast resolutions) and frown (hold music purgatory, anyone?). NPS empowers businesses to focus on improving the moments that truly matter, transforming passive viewers into passionate promoters and turning “meh” experiences into worthy ones. Businesses track this KPI over time to see how their “recommendation score” changes. 83% of buyers believe referrals from family, friends, and coworkers are trustworthy. A rising NPS points to happy customers and potential growth, while a dip signals trouble brewing. Imagine asking your friends after that epic movie night: “Would you recommend this film?” That’s essentially the Net Promoter Score (NPS) – a simple question with significant business meaning.
Example: NPS measures customer loyalty by asking, “On a scale of 0-10, how much would you recommend us to a friend or colleague?” Scores may fall into three categories:
- Promoters (9-10): You’re raving fans, enthusiastically spreading the word.
- Passives (7-8): Satisfied but not passionate, easily swayed by competitors.
- Detractors (0-6): Unhappy customers broadcast loud and clear gripes.
KPI #3. First Response Time (FRT)
First Response Time (FRT), also known as First Reply Time, is pivotal, measuring the interval between a customer’s inquiry and the initial response from an agent. It reflects agent enthusiasm and promptness in addressing customer concerns. A delayed response may lead to customer abandonment. According to research by Forrester, 73% of customers expressed valuing their time is the least the business can do. Studies show a direct correlation between swift responses and increased likelihood of customer purchases. This metric gauges your team’s efficiency and resource adequacy. FRT extends to ticket-based interactions, emphasizing promptly acknowledging requests and queries for heightened customer satisfaction.
Businesses can do it manually by following a simple method. Subtract the time when a consumer submitted a ticket from the time when it was first responded to by the CS agent/team.
Example: If a customer raises the ticket at 4.00 pm and the first response from a support agent takes place at 7.00 pm, the FRT is three hours.
KPI #4. Average Handle Time (AHT)
Ideally, agents spend what is known as “average handle time” (AHT) on each ticket. A faster response time is excellent, but what matters more is the time it takes to fix a problem for your consumers. According to a customer service report, 47 seconds is the benchmark while responding on the live chat of any business with this feature. Cutting down on client wait times and making the most of each back-and-forth conversation are two ways to reduce AHT. You can save considerable time using a hybrid support model, such as human+AI agents, instead of only human ones. An ideal AHT ranges from 2 to 5 minutes. You can calculate it following an easy formula:
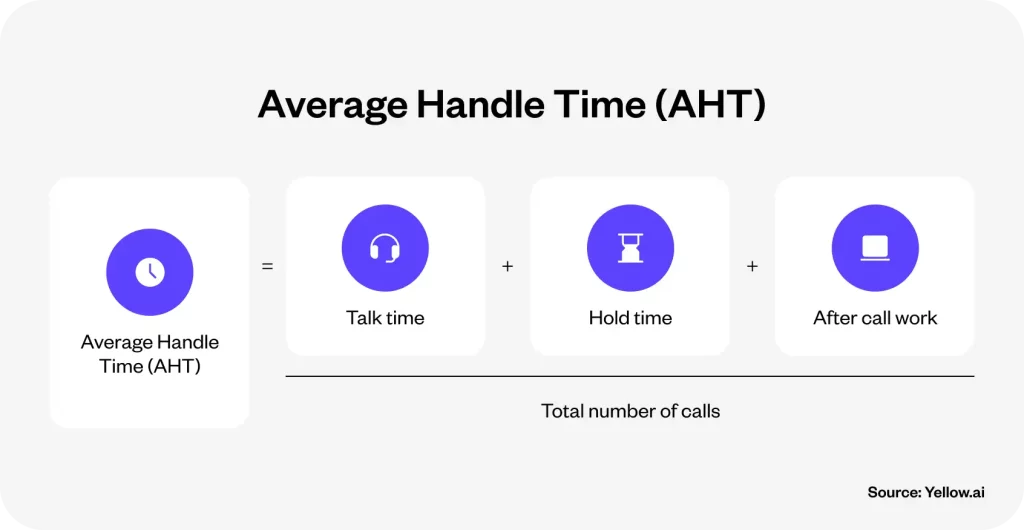
Talk time + Hold time + Post call job / Total count of interactions/ calls by the agent with customers.
Example: a customer service representative redelivers a client’s goods. The handling time is complete once the agent notifies the client of the updated shipment details and closes the ticket. When the consumer gets their hands on the goods, the resolution time ends.
KPI #5. Customer Effort Score (CES)
Customer Effort Score (CES) gauges the extent and amount of effort customers invest in resolving issues or queries. It is a customer experience metric that assesses the ease of their experience, measured on a scale from easy to difficult. Minimizing disruption and streamlining interactions define superior customer service, aligning with CES objectives. Factors like time spent, interactions, and outreach frequency contribute to CES evaluation. Similar to Net Promoter Score (NPS), CES directly correlates with customer satisfaction and business growth. Strive for a lower CES on the 1-10 scale, emphasizing ease and efficiency in customer interactions for optimal satisfaction and sustained business success.
Example: Analyze CES by asking your customers to rate their experience on a scale from “Very Easy” to “Very Tough”. If your CES score is poor, reduce friction and impediments.
KPI #6. Customer churn rate
The customer churn rate helps to measure the percentage of customers who say goodbye. It is your 2024 service KPI spotlight. It can retain your customers on the verge of churning. It’s your leak in the revenue bucket, revealing the impact of your service on loyalty. A low churn indicates success, while a high one shouts, “Fix the leaks!” Analyze the “why” behind churn, plug the gaps with better service, and watch your customer base flourish. Remember, loyalty isn’t earned easily, so prioritize proactive service and build genuine connections to keep your business thriving. The majority of Americans (82%) said they ask friends and family for recommendations before making a purchase, according to a survey by Ambassador in 2021. Thus, know how your brand image matters!
Example: You run a successful gym but suddenly face a 30% churn rate. Each month, you are losing nearly a third of your members! Analyzing ‘why’ and fixing it can retain your members and regain the lost ones.
KPI #7. Service Level Agreement
Many companies set KPI standards using service level agreements (SLAs). It is a contract between a business and its customers that guarantees a certain level of service and specifies the parameters within which the business will continue to interact with the client. This might apply to service quality, accessibility, or responsiveness. Tracking and measuring agent performance is easier with a company-wide standard. Identifying the highest ticket volume hour is helpful. This ensures peak hours are well-staffed and agents can satisfy your SLA.
Example: You can set an SLA, promising every customer support query a response within an hour or less.
KPI #8. Customer Retention Rate
Recognizing the $243 global value of a lost customer emphasizes the importance of customer retention strategies. Customer Retention Rate (CRR) reflects a company’s success in keeping customers over time, fostering loyalty, enhancing ROI, and attracting new customers. Tracking the retention rate post-issue resolution provides insights into sustained customer relationships. Integrating CRM platforms ensures comprehensive data and a 360-degree customer view, which is crucial for assessing overall loyalty. Businesses prioritize improving retention rates as a key customer support metric, showcasing trust and loyalty development.
Example: Track CRR by simple calculation. Suppose out of 100 customers, 80 remained loyal this month; it showcases effective support and sustained satisfaction.
KPI #9. Ticket volume
Another example of a customer service KPI is ticket volume. The number of overall tickets and tickets per client provides an overview of work done and team efficiency. Understanding high ticket times, days, and seasons may help you run your customer service department as a pro. These figures must be examined more thoroughly. A deep-dive examination will reveal if the increased numbers are due to a larger client base or more complaints from disgruntled consumers.
Example: Assume a customer support staff handles 500 tickets every month. The organization can find peak time trends by evaluating ticket volume and strategically handling rising numbers for better efficiency and service.
KPI #10. Abandon rate
The percentage of incoming calls that customers leave without dealing with a service desk or call center worker is the abandon rate in customer service. The formula is: total incoming calls divided by the number of abandoned calls. Wait times are directly correlated with abandon rates. The abandon rate might assist the customer service division in choosing what to do. Thus, the CS department may approve ring-backs, allowing customers to request a callback after waiting in line. Abandonment rates can also help you use other departments’ workers during busy hours.
Example: Suppose a customer service hotline gets 100 calls. Twenty callers abandoning owing to extended wait times are 20% of the abandon rate. In peak hours, the business can offer callbacks to reduce abandonment.
Sony optimizes customer response time with Isha by Yellow.ai

KPI #11. Employee Satisfaction Score
In the customer service industry, where attrition rates are notably high, monitoring Employee Satisfaction Score (ESAT) is crucial. This metric gauges employee contentment with their role, processes, and team, offering insights into potential attrition risks. Retaining skilled agents helps control recruitment, training, and onboarding costs. Frequent employee surveys, regular check-ins, and fostering open communication contribute to a deeper understanding of employee satisfaction. Recognizing the correlation between happy employees and satisfied customers underscores the importance of ESAT, guiding proactive measures for a resilient and content customer service team.
Example: If you have noticed a sudden high attrition rate in your customer service team, conduct regular surveys, engage in one-on-one check-ins, and encourage open communication.
KPI #12. Conversion Rate
The percentage of site visitors who go on to successfully execute an activity is known as the conversion rate. The conversion rate is a crucial KPI in assessing customer service success. Whether online or offline, it gauges the likelihood of customers taking favorable actions, such as making a purchase or subscribing, after the interaction. A high conversion rate signifies effective customer service, influencing successful campaigns and business growth. Analyzing this rate helps optimize engagement, leveraging insights to improve sales conversions and enhance overall customer satisfaction.
Example: Your conversion rate would be 10% if, out of 200,000 visits, 10,000 converted last month on your e-commerce site of your sustainable fashion brand.
KPI #13. Cost per Contact
The cost per contact is one of the critical KPI in customer service. It measures how much each contact costs your call center or each interaction with the customer. It is an integral part of cost-benefit analyses. Whenever one of your CS agents picks up the phone or shoots an email, it costs your customer service division or call center money in wages, investment in technology to handle this division, payments for required software and operating costs. This KPI is closely linked to Average Handle Time (AHT), response time, cost per call metrics, call resolution, and adherence call center KPIs. It is also correlated to the customer satisfaction score and customer service quality. You may get a good idea of the average cost per contact to use as a benchmark by keeping an eye on this KPI throughout several time periods and adjusting for data swings and outliers.
Example: A customer service center handles 1,000 interactions monthly, and the total operational cost, including salaries, technology, and software, is $50,000. The cost per contact is $50 ($50,000/1,000), aiding in assessing efficiency and optimizing resources.
How Yellow.ai can help you automate your customer service?
Yellow.ai has been pivotal in helping businesses automate customer service and support. It has established its forte in extending Generative-AI-powered solutions to leading enterprises worldwide. By using its ever-evolving cutting-edge technology, several industries are experiencing a significant positive impact on customer service, leading to better customer satisfaction and augmented revenue.
1. Improve first response time with Yellow.ai
Advanced AI-powered chatbots are Yellow.ai’s crowning achievement. These bots can grasp user intent and give contextual replies thanks to their programming and deep learning skills. Likewise, employ our data explorer to customize analytics. This business intelligence tool has been helping enterprises to expedite their FRT. Similarly, get to the top of conversational AI in customer service with our help. Going above and beyond simple inquiries, Yellow.ai enables conversations that mimic human interaction, fostering authentic ties with clients.
2. Enhance customer experience with Gen AI
With Yellow.ai’s Generative AI-powered solutions, improving customer experience has never been easier or more effective. In just 30 days after launching, businesses can experience a 90% boost in self-serve automation thanks to goal-based interactions and content-based automation.
3. Reduce abandon rate in customer service with AI voice assistant
Our AI voice assistants can communicate with your customers in more than 135 languages spoken worldwide. Businesses can benefit from this since it allows them to have a virtual assistant available 24/7 and can manage a variety of consumer inquiries.
4. Improvement metrics tracker
AI chatbots by Yellow.ai track customer service metrics or parameters, including response time, resolution rate, and satisfaction. These findings aid data-driven decision-making and enhance services. Chatbots also help you accomplish SMART customer service goals by measuring key indicators and providing exact statistics to assess progress.
Let’s look at a real-world example of Yellow.ai’s influence on customer support automation.
Hyundai augments optimizes customer service using Yellow.ai automation

5. Harness the power of omnichannel presence
With Yellow.ai’s omnichannel automation, you can provide customers with a uniform experience across all channels while preserving the context of conversations. Stay reachable to your consumers and facilitate interesting and hyper-personal interaction over more than 35 platforms.
6. Automate interactions and queries
Our cognitive knowledge search engine, DocCog, may cut down on agent search time and increase efficiency by swiftly retrieving critical information from many sources and systems. Based on our experience, DocCog’s powerful fallback mechanism can improve call deflection by as much as 90%.
Unleash the power of outstanding customer service!

Final thoughts: Stepping towards an effective customer service using KPIs
Dedicated customer service with an omnichannel presence is mandatory for businesses in today’s highly digital era. Gone are the days when customers were satisfied with good quality and budget products or services by a brand. With the market giving them plenty of options, businesses need to be literally on their toes to deliver nothing but the best in customer service and experience. Only then can the latter retain its image, reputation, and customers and acquire new clients. This is when customer service KPIs come in handy to scan through different facets of CS of business and help it identify what’s wrong, take stock of the situation and correct the gaps. This blog educated you on 13 such important KPIs in customer service. Try what suits your needs and budget and boost your performance.