


The old playbook for customer service was written in an era of scarcity. Scarcity of data, scarcity of human agents’ time, and scarcity of instant solutions. Legacy metrics like Average Handle Time (AHT) and First Response Time (FRT) were born from a need to manage “human queues” and minimize labor costs.
In 2026, we have entered the Era of Abundance. AI agents now handle infinite concurrent conversations, and enterprise data is processed in milliseconds. Consequently, the customer service metrics that defined the last decade are becoming “vanity metrics.” Modern CX leaders are moving away from measuring activity and toward measuring outcomes, authority, and emotional resonance.
The Narrative Shift: The Great Decoupling
For decades, the customer service industry was governed by a linear equation: The more customers you had, the more human heads you needed. To manage this cost, “Automation” was historically used for deflection, a digital wall built to protect expensive human resources by filtering out “simple” queries.
In 2026, we are witnessing “The Great Decoupling.” For the first time in service history, the quality of customer experience is being separated from human headcount.
From Gatekeeping to Empowering
In the legacy model, every automated interaction was a “shield.” Customer success was measured by how many people didn’t reach a human. This created a Gatekeeper Mindset, where the goal was to minimize contact. Today, the mindset has flipped to Agentic Autonomy.
- The 2025 Focus (Passive Automation): AI acted as a triage layer. It could tell a customer where to find a refund form, but it couldn’t sign the check. If the customer got stuck, the “deflection” became “delay,” leading to higher frustration when they finally reached a human.
- The 2026 Standard (Active Autonomy): AI acts as a digital colleague with Outcome Authority. It doesn’t deflect the customer; it absorbs the complexity. Because AI can now access the full enterprise tech stack, it can process the refund, rebook the flight, or troubleshoot the hardware issue end-to-end.
Pro Tip: Shift your focus from Deflection to Autonomous Resolution. Ask your team: “How many of our top 20 manual workflows is the AI now authorized to handle start-to-finish?” Real efficiency isn’t about the AI giving a customer the right link; it’s about the AI having the API permissions to finish the job so your human agents don’t have to.
The 2026 Customer Service Metric Framework: 5 Important Pillars
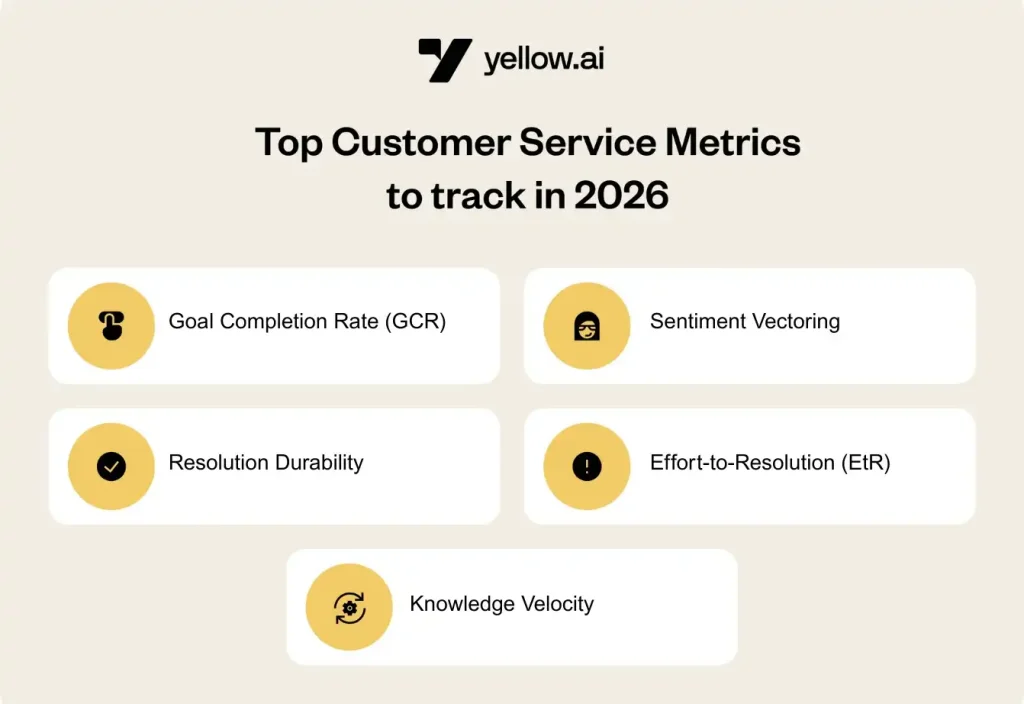
To navigate this age of autonomy, enterprise leaders must retire metrics that merely track activity and adopt those that validate institutional authority and customer success.
1. Goal Completion Rate (GCR)
Traditional Containment Rate is a deceptive metric; it only tracks if a user stayed in a digital channel, not if they actually solved their problem. Goal Completion Rate (GCR) is the 2026 upgrade. It measures the percentage of interactions where the customer’s specific intent was fully executed via an autonomous action, such as an API-led refund, a diagnostic fix, or a policy override.
- The Strategic Insight: High containment with low GCR is a recipe for churn. In an agentic world, your AI must have the “hands” to work, not just the “voice” to talk.
- Actionable Insight: Audit your bot logs for “Intent Abandonment.” If a user asks for a refund and the bot explains the policy but doesn’t trigger the transaction, that is a GCR failure.
2. Resolution Durability (Zero Follow-up Rate)
First Contact Resolution (FCR) is easily gamed, agents (human or AI) can close tickets to meet targets without truly solving the issue. Resolution Durability tracks the “shelf-life” of a solution. It measures if a query stayed resolved for at least 7 to 10 days without a recursive contact.
- The Strategic Insight: Durability exposes “Band-Aid” support. If an AI agent provides a temporary fix that leads to a follow-up three days later, it has failed the durability test. 2026 leaders prioritize permanent fixes over fast ones.
- The Formula: Resolution Durability = ((Total Resolved – Recursive Contacts) / Total Resolved) * 100
3. Sentiment Vectoring: The Survey-less CSAT
CSAT surveys suffer from “vocal minority” bias, usually only capturing the 5% of customers who are extremely happy or angry. Sentiment Vectoring uses LLMs to analyze the emotional “delta” of 100% of your interactions.
- The Strategic Insight: It tracks the emotional journey. Did a customer start the chat as “Frustrated” and end as “Relieved”? This “Sentiment Lift” is a much more accurate predictor of Customer Lifetime Value (CLV) than a post-chat star rating.
- The 2026 Advantage: This allows for real-time intervention. If the sentiment vector drops sharply, the AI can auto-escalate to a human agent before the customer even asks.
Success Story: From Silent Churn to 12% Retention Lift
A global telecom provider found that 20% of churning customers were “Silent Quitters”, users who gave “Neutral” 3-star CSAT ratings before leaving.
By switching to Sentiment Vectoring, the brand identified a critical pattern: customers who started “Anxious” and ended “Neutral” were 3x more likely to churn than those ending “Relieved.”
The Result: The AI now auto-triggers personalized follow-ups for any interaction that fails to achieve a “Sentiment Lift.” This pivot turned silent churn into a 12% increase in retention and a 22% rise in Customer Lifetime Value (CLV).
4. Effort-to-Resolution (EtR)
In 2026, “time” is no longer the primary frustration, effort is. Customers don’t mind a 45-second wait for an AI to process a complex claim, but they hate repeating their account number.
Effort-to-Resolution (EtR) tracks micro-actions: clicks, repeats, and channel switches.
- The Strategic Insight: A “low-effort” customer experience is the #1 driver of brand loyalty. By tracking the Path to Resolution, you can identify “friction hotspots” where your AI agent is asking redundant questions.
- The Formula: EtR Score = Total Micro-Actions (clicks + repeats + channel switches) / Resolved Interactions. Lower is better—best-in-class orgs aim for under 3 actions per resolution.
5. Knowledge Velocity
As markets move faster, the gap between a business change (e.g., a new policy or a service outage) and the AI’s ability to handle it becomes a liability. Knowledge Velocity measures the time it takes to sync your “Truth Layer” (Knowledge Base) with your “Action Layer” (AI Agents).
- The Strategic Insight: In the era of RAG (Retrieval-Augmented Generation), your AI is only as good as your data. High Knowledge Velocity ensures customers never receive hallucinated or outdated information.
- The Benchmark: Best-in-class orgs sync policy or product changes to their AI knowledge base within minutes or in case of huge volume of resources in a couple of hours. If your sync time is measured in days, you’re exposing customers to stale or incorrect answers.
The Legacy Audit: 4 Metrics to Retire in 2026
To shift to an autonomous model in 2026, you need to stop managing digital labor with a human stopwatch. These four KPIs are now the top “blind spots” that hide operational friction rather than exposing it:
- Average Handle Time (AHT): Handle time is a labor-cost proxy. Since AI capacity is now infinite, “talk time” is a zero-cost variable. The only thing that matters now is Time to Value (TTV), how many seconds it took to actually eliminate the customer’s problem.
- Containment Rate: Keeping a customer in a digital channel is a vanity metric if their issue isn’t resolved. High containment without high resolution is just a hidden backlog that eventually hits your human agents anyway.
- CSAT Score (Survey-based): You can’t run a business on a 3% response rate from the vocal extremes of your customer base. In 2026, we don’t need to ask the customer if they were happy; we use Sentiment Delta to analyze the data from 100% of the conversations and the overall customer journey.
- First Contact Resolution (FCR): FCR tracks the moment a ticket is closed, not the moment a problem is fixed. If the solution doesn’t hold and the customer calls back in 48 hours, the initial “resolution” was a failure of durability, not a win for efficiency.
The CX Evolution: Transitioning to Outcome-Based Intelligence
While each of the customer service metric pillars provide a deep-dive into specific performance areas, the true power of a 2026 service strategy lies in how they coalesce to replace traditional operational silos with a unified, outcome-driven intelligence framework.
| Category | Legacy Benchmark (Operational) | 2026 Standard (Outcome-Based) | Strategic Business Impact |
| Efficiency | Average Handle Time (AHT) | Time to Value (TTV) | Optimizes for the speed of solution rather than the duration of the dialogue. |
| Execution | Containment Rate | Goal Completion Rate (GCR) | Validates AI authority through successful transactional outcomes. |
| Sentiment | CSAT Score (Surveys) | Sentiment Delta / Lift | Captures 100% of emotional data without survey fatigue. |
| Reliability | Bot Accuracy | Resolution Durability | Shifts focus from whether the AI answered correctly to whether the fix actually lasted, minimizing repeat contacts and hidden operational costs. |
Orchestrating 2026 Outcomes with Yellow.ai
Transitioning to 2026 standards requires a platform designed for autonomy, not just automation. Yellow.ai provides the enterprise-grade infrastructure needed to turn these advanced metrics into business results.
- Driving Goal Completion: Through Agentic RAG, Yellow.ai moves beyond “FAQ bots” to autonomous agents empowered to execute end-to-end transactions. By integrating directly into your ERP and CRM, the AI doesn’t just guide, it resolves.
- Automating Sentiment Analysis: Yellow.ai’s Analyze suite eliminates survey bias by calculating Sentiment Delta across 100% of interactions. This provides immediate visibility into the emotional ROI of your CX strategy.
- Ensuring Resolution Durability: With Self-Learning Loops, the platform identifies successful resolution patterns and proactively updates your Knowledge Base. This ensures high Knowledge Velocity and prevents the recurrence of resolved issues.
Conclusion: Metrics as a Strategy, Not a Report
In 2026, the most effective customer service is the one that feels invisible. The transition from operational volume to autonomous resolution requires a mindset shift: stop treating customers as “tickets to be closed” and start treating them as relationships to be resolved. The organizations that win in this era won’t be those with the fastest response times, but those that provide the most durable, effortless, and emotionally intelligent outcomes.
By leveraging an agentic platform, you ensure your service layer becomes a primary driver of brand trust and long-term customer value. Experience the 2026 standard in Autonomous Customer Service.
Empower your customer service with Yellow.ai