


Executive summary
Diving into call center metrics is crucial for businesses seeking to elevate their customer service and efficiency. This blog breaks down essential metrics, highlighting their significance in enhancing call center operations. With practical insights on optimizing key indicators such as Average Handle Time, Service Level Rate, and CSAT Scores, we empower businesses to leverage technology, like AI solutions from Yellow.ai, to refine customer experiences and operational performance.
At the core of every successful business is a dynamic call center, where each conversation has the power to strengthen customer loyalty. Understanding call center metrics is like having a compass that guides you toward exceptional customer service. In an era where AI is transforming customer interactions, mastering these metrics is essential for any business aiming to stand out. This guide elucidates the various metrics and also demonstrates how leveraging them effectively can transform your call center into a powerhouse of customer satisfaction and efficiency.
Imagine a call center that exceeds customer expectations with every interaction. By exploring key performance indicators (KPIs), let’s uncover strategies to enhance the quality of your call center’s operations. From leveraging the latest in AI technology to implementing tried-and-true practices, this journey through call center metrics will equip your business with the tools needed to create a customer service environment that is efficient and empathetic. Read on to redefine excellence in your call center, ensuring your customer service isn’t just good—it’s exceptional.
Related must-reads:
- Call center automation – Types, benefits and steps to implement
- Call center software – A Complete Guide [2024]
- What are the benefits of contact center AI?
- Omnichannel contact center: A guide for managers
What are call center metrics?
Call center metrics are the backbone of operational excellence. They provide a comprehensive view of how effectively a call center functions. These metrics, encompassing a wide array of performance indicators, illuminate the path to understanding and enhancing the customer experience from the first ring. They’re the quantifiable evidence of a call center’s efficiency, customer satisfaction, and overall health. These metrics offer insights into the intricacies of customer interactions and service delivery.
At its core, call center metrics delve into crucial aspects of the customer journey. These aspects include accessibility, issue resolution speed, customer satisfaction levels, and areas ripe for improvement. They’re the tools that dissect the operational dynamics of a call center, from the volume of calls handled to the nuanced perceptions of service quality from the customer’s viewpoint. By wielding these metrics, businesses unlock the potential to sculpt service strategies that resolve issues and also elevate customer satisfaction to new heights.
The significance of call center metrics transcends mere numbers; they’re the strategic assets in the quest for exceptional customer service. For businesses, understanding and applying these metrics means engaging in a continual process of refinement and adaptation. It ensures every customer interaction is an opportunity to impress and retain. In the competitive landscape where every call counts, call center metrics stand as the lighthouse, guiding businesses toward service excellence and operational prowess. That helps a business cement its place in the hearts of customers.
Related read: Contact center experience: Types + Ways to improve
Why are call center metrics important?
Incorporating call center metrics into a business’s strategic operations is akin to setting the sails for a successful customer service journey. These metrics illuminate the path to enhancing customer interactions, streamlining operations, and fostering a culture of continuous improvement.
In a landscape where 52% of US and UK customers report switching providers due to poor experiences, and 90% of those customers emphasize the importance of immediate responses, the stakes could not be higher. The significance of call center metrics extends beyond mere operational efficiency; it directly impacts customer loyalty and the bottom line.
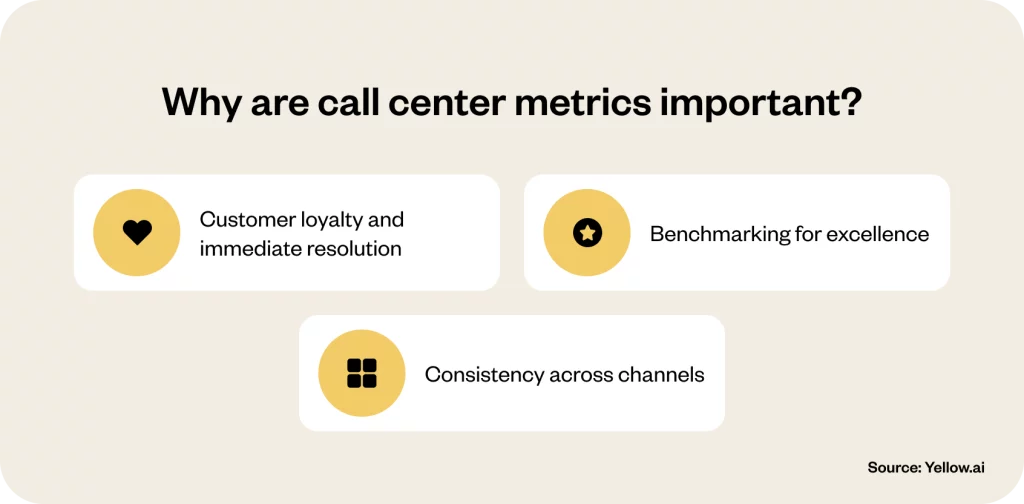
Customer loyalty and immediate resolution
The data tells a compelling story: when customer issues are resolved on the first call, loyalty skyrockets, with 99% of customers likely to stay with a company, compared to 85% who are forced to make follow-up calls. This stark contrast underlines the critical role of call center metrics in ensuring first-call resolution, a key driver of customer satisfaction and retention.
Related read: Customer Retention: 15 Strategies to Improve CR
Benchmarking for excellence
Beyond individual performance, call center metrics serve as a benchmarking tool. They enable businesses to measure their performance against industry standards, identify areas for improvement, and implement targeted strategies to enhance customer satisfaction. In a competitive landscape, these insights are invaluable for maintaining an edge and ensuring that every customer interaction is a step toward building loyalty.
Consistency across channels
With 41% of Americans still utilizing landlines for customer service inquiries, the relevance of call center metrics extends across all communication channels. These metrics ensure that the quality of service remains consistent, whether a customer chooses to interact via phone, email, or live chat. Salesforce’s research further underscores this, revealing that 75% of consumers expect consistent experiences across all touchpoints, with 73% ready to switch brands if their expectations are not met.
Call center metrics, therefore, are not just numbers but strategic assets that enable businesses to navigate the complex terrain of customer service. They offer a clear roadmap for enhancing customer experiences, fostering loyalty, and driving sustainable growth. Ignoring these metrics is equivalent to sailing without a compass, risking customer loyalty and the very success of the business in the unpredictable seas of the market.
So, ready to revolutionize your call center experience?
Top call center metrics and KPIs to monitor
At the heart of every successful call center lies a set of key performance indicators (KPIs) and metrics carefully designed to gauge productivity. These metrics serve as the compass that guides call center operations toward excellence, ensuring every customer interaction is optimized for satisfaction and efficiency. Understanding these metrics is crucial for businesses looking to streamline their call center operations, improve customer service, and ultimately enhance their bottom line.
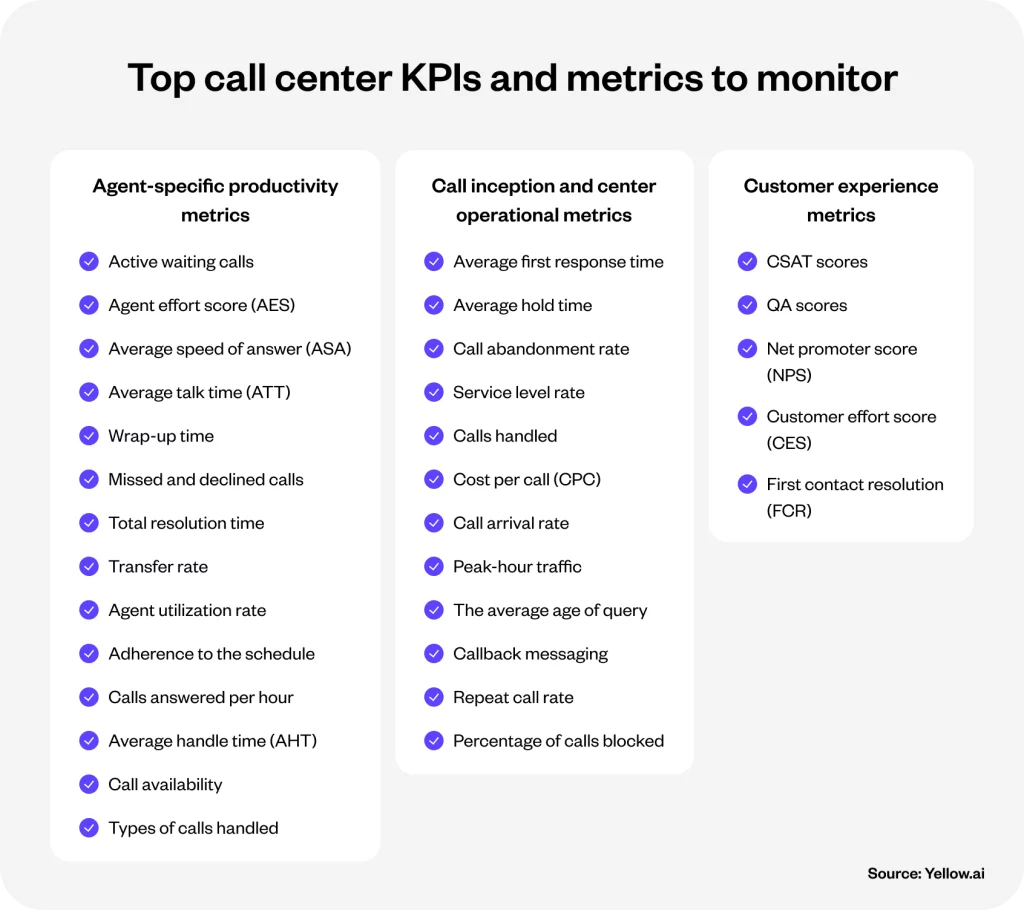
Agent-specific productivity metrics
Let’s explore the top agent-specific productivity metrics that are instrumental in shaping a high-performing call center team.
Related read: AI agents: types, benefits, and examples
Metrics #1. Active waiting calls
Active waiting calls measure the current volume of calls waiting in the queue versus those being actively handled by agents. It’s a critical metric that reflects the call center’s ability to manage incoming call traffic effectively and maintain service levels. An optimal balance ensures that customers are connected to an agent as swiftly as possible, enhancing their overall experience.
When active waiting calls are low, it indicates a highly responsive and efficient call center operation, directly contributing to customer satisfaction by minimizing wait times. Conversely, high volumes of waiting calls can lead to customer frustration, potentially affecting their perception of the brand negatively and increasing the likelihood of call abandonment.
The formula for calculating active waiting calls is:
Percentage of active waiting calls = (Total number of calls on hold / Total incoming calls) * 100
For example, if a call center receives 100 calls in an hour and 80 of those are immediately connected to an agent, there are 20 active waiting calls. So, the percentage of active waiting calls is 20%.
Ways to improve
- Optimize staffing: Ensure enough agents are scheduled during peak hours.
- Leverage call routing: Use IVR systems to direct callers to the appropriate agent or department efficiently.
- Offer callback options: Reduce immediate demand by giving customers the option to receive a callback when an agent becomes available.
Metrics #2. Agent effort score (AES)
The Agent Effort Score assesses how easy it is for agents to resolve customer inquiries and issues. A lower effort score signifies that agents can efficiently manage tasks, leading to quicker resolutions and a better customer experience. This metric is essential for understanding the obstacles agents face in their day-to-day operations.
According to a Gartner study, 96% of customers with a high-effort service interaction become more disloyal compared to just 9% who have a low-effort experience.
A high AES can indicate systemic issues that make it difficult for agents to perform their duties, potentially leading to longer resolution times and decreased customer satisfaction. Addressing the factors contributing to a high AES can streamline operations, improve agent morale, and enhance customer interactions.
AES can be calculated by surveying agents on the effort required to handle calls, often on a scale from 1 (low effort) to 5 (high effort).
For example, if the total score from all agents is 500 and there were 100 responses, the AES would be 5, indicating a high effort level.
AES = Total effort scores / Number of responses
Ways to improve:
- Provide effective tools: Equip agents with comprehensive CRM systems for easy access to customer data.
- Streamline processes: Simplify workflows and reduce the steps needed to resolve common issues.
- Training and support: Offer ongoing training to enhance agent skills and confidence in handling calls.
Metrics #3. Average speed of answer (ASA)
The Average Speed of Answer is the average time it takes for a call center agent to answer an incoming call. This metric is a direct indicator of how quickly customers can expect to interact with an agent, impacting their initial impression of the service quality.
A lower ASA indicates a highly responsive call center that values customers’ time and contributes positively to customer satisfaction. On the other hand, a high ASA may deter customers from continuing their call, leading to dissatisfaction and potential loss of business.
ASA is calculated by dividing the total wait time for answered calls by the total number of answered calls.
For instance, if customers wait a total of 400 minutes to be connected to an agent over 200 calls, the ASA would be 2 minutes.
ASA = Total wait time for answered calls / Total number of answered calls
Ways to improve:
- Adjust staffing levels: Ensure adequate staffing during anticipated high-volume periods.
- Enhance call routing: Utilize advanced IVR systems to reduce unnecessary wait times.
- Monitor real-time data: Use real-time analytics to adjust resources dynamically as demand changes.
Metrics #4. Average talk time (ATT)
Average Talk Time measures the duration an agent spends on a call with a customer. This metric is vital for assessing the efficiency and effectiveness of agent-customer interactions. Optimizing ATT ensures agents can resolve issues promptly while maintaining quality service.
A balanced ATT is crucial; too short might indicate rushed conversations without fully resolving customer issues, while too long could suggest inefficiencies in handling calls. Maintaining an optimal ATT is vital to maximizing call center throughput without compromising customer satisfaction.
ATT = Total talk time / Total number of calls
Here,
Total talk time = Total time spent talking to a customer on the phone
If agents spend a total of 500 minutes talking across 100 calls, the ATT is 5 minutes.
This duration reflects the efficiency of interactions and the potential need for training or process adjustments.
Ways to improve
- Training: Regularly train agents to handle inquiries more effectively.
- Call scripts: Implement structured call scripts for common issues to provide quick resolutions.
- Knowledge base: Develop a comprehensive knowledge base for agents to find information quickly.
Metrics #5. Wrap-up time
Wrap-up time is the period an agent spends on post-call tasks such as updating customer records or scheduling follow-up tasks. Minimizing wrap-up time is essential for improving agent availability for new calls and enhancing overall call center productivity.
Efficient wrap-up practices ensure that agents can swiftly move on to the next call, reducing customer wait times and increasing the call center’s capacity to handle high volumes of calls. High wrap-up times can bottleneck the call-handling process, affecting service levels.
Wrap-up Time = (Total handle time – Total talk time – Total hold time) / Total number of calls
For example, if the handling time for 100 calls is 600 minutes, with talk and hold times amounting to 500 minutes, the wrap-up time is 1 minute per call.
Ways to improve:
- Automate data entry: Use CRM integrations to automate the updating of customer records.
- Streamline processes: Simplify the steps required for post-call tasks.
- Clear guidelines: Establish clear guidelines for necessary post-call work to prevent unnecessary tasks.
Metrics #6. Missed and declined calls
This metric tracks the number of calls that agents do not answer or decline. A low rate of missed and declined calls is indicative of a well-staffed and efficient call center where customers can reliably reach an agent.
Reducing missed and declined calls is critical for maintaining customer trust and satisfaction. High rates may lead to customer frustration and lost opportunities for engagement or sales. Monitoring this metric helps identify staffing or routing issues that need to be addressed.
Missed and declined calls rate = (Total missed calls / Total incoming calls) * 100
If a call center receives 1,000 calls and misses 100, the rate is 10%.
Ways to improve
- Adjust staffing levels: Ensure adequate coverage during peak hours to reduce missed calls.
- Improve call routing: Refine IVR menus and routing rules to distribute calls more effectively.
- Offer callback options: Allow customers to request callbacks instead of waiting in queue, reducing the likelihood of missed calls.
Metrics #7. Total resolution time
Total Resolution Time measures the cumulative time taken by an agent to fully resolve a customer’s issue, from the initial contact to the final resolution. This metric underscores the efficiency and effectiveness of the problem-solving process within a call center.
A shorter Total Resolution Time signifies efficient problem-solving and contributes to higher customer satisfaction, as issues are resolved swiftly. Conversely, extended resolution times indicate inefficiencies or the need for additional training, potentially leading to customer dissatisfaction.
Total Resolution Time = Sum of all resolution times / Number of resolved issues
For instance, if an agent resolves 10 issues in a total of 400 minutes, the average resolution time is 40 minutes per issue. This figure helps identify the effectiveness of the resolution process.
Ways to improve:
- Enhanced training: Provide agents with comprehensive training on problem-solving and product knowledge.
- Resource accessibility: Ensure easy access to knowledge bases and support resources.
- Process optimization: Streamline resolution processes and eliminate unnecessary steps.
Metrics #8. Transfer rate
The Transfer Rate metric quantifies the percentage of calls transferred from one agent to another or a different department. It reflects the call center’s ability to correctly route calls to the appropriate agent or department initially.
A high Transfer Rate may suggest issues with call routing or a lack of agent knowledge, leading to a disjointed customer experience. Optimizing this rate ensures that customers are connected to the most appropriate resource from the start, enhancing their overall satisfaction.
Transfer Rate = (Total transferred calls / Total handled calls) * 100
If 100 of 1,000 handled calls are transferred, the transfer rate is 10%. It indicates the proportion of calls that require re-routing.
Ways to improve:
- Better call routing: Improve the IVR system to ensure more accurate initial call routing.
- Cross-training: Cross-train agents to handle a broader range of inquiries.
- Clear transfer protocols: Establish guidelines for when and how to transfer calls efficiently.
Metrics #9. Agent utilization rate
Agent Utilization Rate measures the proportion of time agents spend handling calls or performing call-related tasks compared to their total available working hours. It is a critical indicator of productivity and operational efficiency in a call center.
An optimal Utilization Rate ensures that agents are effectively engaged in productive work without being overburdened, balancing efficiency with agent well-being. Extremely high rates indicate overworked agents, while too low rates suggest underutilization or staffing inefficiencies.
Agent Utilization Rate = {(Average number of calls handled * Average time of calls handled) / Total available time} * 100
For an agent with 6 hours of talk and wrap-up time in an 8-hour shift, the utilization rate is 75%. This ratio indicates how much of the agent’s time is devoted to productive activities.
Ways to improve:
- Workforce management: Implement scheduling software to optimize staffing based on call volume forecasts.
- Efficiency tools: Provide agents with tools that streamline call handling and post-call work.
- Regular breaks: Ensure agents have sufficient breaks to prevent burnout and maintain high productivity levels.
Metrics #10. Adherence to the schedule
Adherence to Schedule measures how closely agents follow their planned work schedules, including their presence for shifts, breaks, and off-phone work. This metric is crucial for ensuring that staffing aligns perfectly with call volume predictions, thereby maintaining service levels.
Consistently high adherence rates mean that the call center can reliably meet customer demand without unnecessary wait times or service disruptions. Poor adherence, on the other hand, can lead to understaffing issues, increased wait times, and, ultimately, customer dissatisfaction.
Adherence Rate = {(Time on calls + Time on after-call work) / Scheduled time} * 100
If an agent is scheduled for 8 hours and spends 7.5 hours on calls and related tasks, their adherence rate is 93.75%. It indicates a high level of compliance with the scheduled work.
Ways to improve
- Realistic scheduling: Create schedules that account for natural work rhythms and break needs.
- Clear communication: Ensure agents understand the importance of adherence and its impact on the team and customers.
- Incentives for adherence: Reward agents who consistently meet or exceed adherence expectations to encourage compliance.
Metrics #11. Calls answered per hour
This metric calculates the average number of calls an agent answers within an hour, providing a direct measure of productivity and efficiency.
A higher rate of calls answered per hour indicates efficient handling and optimization of available resources. However, it’s crucial to balance quantity with quality—ensuring that the drive for more calls does not compromise the customer experience.
Calls Answered per Hour = Total calls answered / Total hours worked
If an agent answers 60 calls over an 8-hour shift, their rate is 7.5 calls per hour. This metric helps managers assess individual and overall productivity.
Ways to improve
- Efficient call routing: Use advanced routing techniques to match calls with the right agents quickly.
- Agent training: Continuously train agents to handle calls more effectively and efficiently.
- Use of technology: Implement call center technologies that streamline call handling, such as auto-dialers and CRM systems.
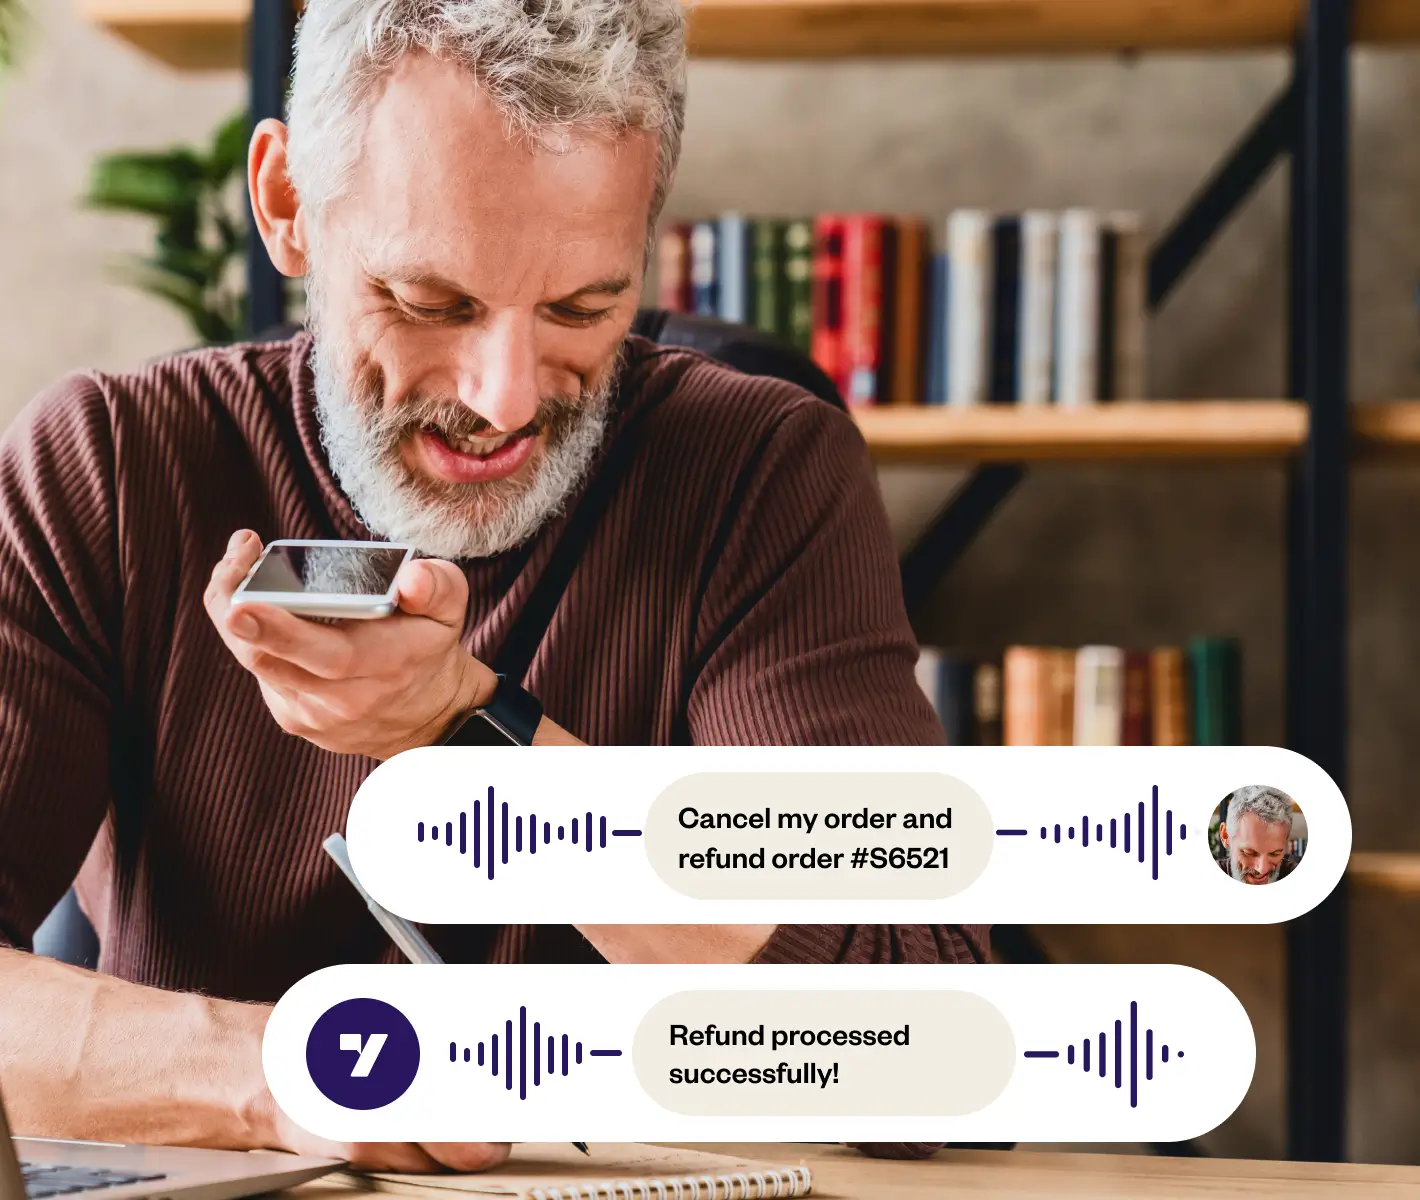
Unrivaled voice automation – AI never sounded so human
Metrics #12. Average handle time (AHT)
Average Handle Time is the average duration it takes for an agent to conclude a call, including talk time, hold time, and after-call work. AHT is a comprehensive measure of how effectively an agent manages each interaction.
Optimizing AHT can lead to more efficient call handling, allowing agents to assist more customers within the same timeframe without rushing interactions. Excessively long or short AHTs may indicate issues with process efficiency or call quality, respectively.
AHT = (Total talk time + Total hold time + Total wrap-up time) / Total calls handled
For example, if the total time spent on 100 calls is 5000 minutes, the AHT is 50 minutes. This figure can guide targeted improvements to reduce unnecessary delays.
Ways to improve
- Robust training: Equip agents with the skills to handle calls more efficiently.
- Knowledge sharing: Implement a knowledge base for quick information retrieval.
- Process streamlining: Review and optimize workflows to reduce unnecessary steps.
Metrics #13. Call availability
Call Availability measures the percentage of time an agent is available to take calls during their shift, reflecting their readiness to assist customers.
High call availability ensures that customers can quickly connect with an agent, reducing wait times and improving the overall customer experience. Low availability may signal scheduling inefficiencies or excessive after-call work.
Call availability = (Total available time / Scheduled time) * 100
If an agent is available for calls for 360 minutes out of a 480-minute shift, their call availability is 75%. It indicates the proportion of time they are ready to serve customers.
Ways to improve
- Efficient scheduling: Align agent schedules closely with call volume patterns.
- Reduce after-call work: Automate or streamline after-call tasks to free up more time for calls.
- Encourage promptness: Foster a culture where agents are encouraged to return to available status after breaks or tasks promptly.
Metrics #14. Types of calls handled
This metric categorizes the various types of calls an agent handles, providing insight into the diversity of customer needs and agent versatility.
Understanding the types of calls handled can help in training agents more effectively, ensuring they are well-equipped to manage a range of customer inquiries and issues. It can also aid in better call routing and specialization among agents.
Ways to improve
- Specialized training: Offer targeted training sessions for different call types to improve handling efficiency.
- Call routing optimization: Use intelligent routing to direct specific types of calls to agents with the relevant expertise.
- Feedback and review: Regularly review call types with agents to identify areas for improvement and to update training materials accordingly.
Call inception and center operational metrics
Below are the top call inception and call center operational metrics that businesses must consider.
Metrics #15. Average first response time
The moment a customer reaches out, the clock starts ticking. Average First Response Time measures the swiftness with which agents initiate contact after a customer’s initial query. It’s the first step in building trust and setting the tone for the interaction.
A prompt first response can significantly enhance customer satisfaction, signaling that their concerns are a priority. Conversely, delays in initial contact can foster frustration, potentially souring the customer experience from the outset.
AFRT = Total first response time / Total inquiries
For instance, if the total first response time for 100 inquiries is 200 minutes, the AFRT is 2 minutes. This efficiency in initial engagement can set a positive trajectory for customer interactions.
Ways to improve
- Automate acknowledgments: Implement automated responses to acknowledge customer queries immediately.
- Optimize agent allocation: Ensure adequate staffing during peak times to reduce response delays.
- Monitor and train: Regularly review response times and provide targeted training to improve agent performance.
Metrics #16. Average hold time
After initiating contact, the next critical phase is keeping customers engaged. Average Hold Time quantifies the duration customers spend waiting on hold during a call. It reflects the operational efficiency and customer handling capacity of the call center.
Minimizing hold time is pivotal for maintaining customer patience and interest. Excessive waiting can lead to call abandonment and diminish overall satisfaction with the service received.
AHT = Total hold time / Total calls
If customers spent 500 minutes on hold across 250 calls, the AHT is 2 minutes. Lowering this metric is vital to improving the customer experience.
Ways to improve
- Streamline processes: Simplify call handling procedures to reduce the need for extended holds.
- Enhanced training: Equip agents with comprehensive product and process knowledge to resolve queries faster.
- Implement call-back options: Offer customers the option to receive a call-back rather than wait on hold.
Metrics #17. Call abandonment rate
The Call Abandonment Rate is a stark indicator of customer patience thresholds. It measures the percentage of calls disconnected by the customer before reaching an agent. High rates can be symptomatic of operational inefficiencies or under-resourcing.
A lower abandonment rate indicates an efficient, responsive call center operation. High rates can signal potential systemic issues, impacting customer loyalty and the brand’s reputation.
CAR = (Total abandoned calls / Total incoming calls) * 100
If out of 1,000 incoming calls, 100 were abandoned, the CAR is 10%. Addressing the factors contributing to this rate is crucial for customer retention.
Ways to improve
- Adjust staffing levels: Align agent availability with call volume trends to reduce wait times.
- Optimize call routing: Use intelligent call routing to decrease wait times and evenly distribute call loads.
- Offer alternative channels: Provide multiple channels for customer queries, reducing pressure on voice channels and lowering abandonment rates.
Metrics #18. Service level rate
Service Level Rate is a critical metric that gauges the efficiency of a call center in meeting predefined service criteria, typically defined as the percentage of calls answered within a specific timeframe. It acts as a barometer for customer accessibility and service responsiveness.
A high service level rate signifies a responsive and customer-centric operation, directly influencing customer satisfaction and loyalty. Falling short of set service levels can lead to customer dissatisfaction and potential loss of business.
SLR = (Calls answered within threshold / Total calls offered) * 100
If 900 out of 1,000 calls were answered within the 20-second threshold, the SLR is 90%. It indicates strong performance against service objectives.
Ways to improve
- Optimize staffing: Adjust schedules and staffing based on call volume forecasts to ensure readiness.
- Enhance training: Empower agents with tools and knowledge to handle calls efficiently.
- Implement call-back technology: Reduce wait times and improve service levels by offering call-back options to customers.
Metrics #19. Calls handled
This metric reflects the total number of calls agents successfully manage over a specific period. It’s indicative of the call center’s capacity to manage customer queries and issues effectively.
An increase in calls handled is often seen as a positive indicator of productivity and operational efficiency. However, it’s crucial to balance quantity with the quality of interactions to ensure customer satisfaction is not compromised.
CH = Total calls answered.
For simplicity, if an agent answers 100 calls in a day, the calls handled metric for that agent is 100. This straightforward count provides a baseline for productivity assessments.
Ways to improve
- Efficiency training: Equip agents with strategies to handle calls more swiftly without sacrificing service quality.
- Technology integration: Use advanced call distribution and management systems to maximize call handling efficiency.
- Balanced metrics: Encourage a balanced focus on both the number of calls handled and the quality of those interactions.
Metrics #20. Cost per call (CPC)
Cost per Call calculates the average expense incurred for each call handled, encapsulating direct and indirect costs associated with call center operations. It’s a crucial metric for understanding the financial efficiency of call center activities.
Maintaining a low CPC is essential for optimizing operational budgets while ensuring quality customer service. A rising CPC may indicate inefficiencies or escalating costs that need to be addressed to maintain profitability and service standards.
CPC = Total operational costs / Total calls handled
If the operational cost for a day is $5,000 and 1,000 calls were handled, the CPC is $5. This figure helps in budgeting and financial planning for call center operations.
Ways to improve
- Process optimization: Streamline call handling processes to reduce operational costs.
- Training and development: Invest in agent training to improve efficiency and reduce the need for repeat calls, thereby lowering costs.
- Leverage technology: Use automation and AI to handle routine inquiries, reducing the load on agents and the associated costs.
Metrics #21. Call arrival rate
The Call Arrival Rate measures the frequency of incoming calls within a specific time frame, offering insights into call volume patterns and helping with workforce planning.
Understanding call arrival rates is crucial for resource allocation, ensuring that enough agents are available to handle peak times without unnecessary idle periods during off-peak hours.
CAR = Total number of incoming calls / Time period
For instance, if 500 calls are received over 5 hours, the call arrival rate is 100 calls per hour, signaling the need for adequate staffing during these hours.
Ways to improve
- Dynamic scheduling: Adjust agent schedules based on historical call arrival patterns.
- Self-service options: Implement IVR systems and chatbots to manage routine inquiries, reducing call volumes during peak hours.
- Customer education: Use online resources to inform customers about the best times to call or alternative support channels.
Metrics #22. Peak-hour traffic
This metric identifies the times when call volume is at its highest, highlighting the demand spikes within the call center’s operational hours.
Recognizing peak-hour traffic allows for precise workforce management, ensuring that customer wait times are minimized and service levels are maintained during periods of high demand.
PHT = Highest Call Volume Time Blocks
If the call center receives its highest call volumes from 10 AM to 12 PM, this period is identified as the peak-hour traffic window, necessitating strategic staffing and resource planning.
Ways to improve
- Preemptive staffing: Increase agent availability during anticipated peak hours based on historical data.
- Load balancing: Distribute calls more evenly by encouraging customers to call at less busy times through incentives.
- Efficiency enhancements: Streamline call handling processes to reduce the duration of each call, alleviating pressure during peak hours.
Metrics #23. The average age of query
This metric calculates the average duration that customer queries remain unresolved, providing insights into the efficiency of problem resolution processes.
A lower average age of query indicates swift resolution times, leading to higher customer satisfaction. Conversely, longer durations may point to systemic issues or inefficiencies in handling customer concerns.
AAQ = Total age of all open queries / Number of open queries
If the total age of all open queries is 600 days and there are 200 open queries, the average age is 3 days. This metric sheds light on the effectiveness of resolution strategies.
Ways to improve
- Prioritization: Implement a priority system for queries to ensure timely responses to urgent matters.
- Agent empowerment: Provide agents with the tools and authority to resolve issues quickly, reducing the need for escalations.
- Continuous training: Regularly update training programs to equip agents with the skills needed to handle a wide array of queries efficiently.
Metrics #24. Callback messaging
Callback messaging is a customer service feature that allows customers to request a callback rather than wait in a queue. This metric tracks the volume of callback requests and their resolution effectiveness.
Implementing a callback option can significantly improve customer satisfaction by reducing wait times and showing respect for the customer’s time. It also helps in managing call volumes more efficiently during peak hours.
Callback Rate = Number of callback requests / Total calls received
For example, if a call center receives 1,000 calls in a day and receives 150 requests for callbacks, the callback rate is 15%. It indicates customers’ preference for callbacks over waiting.
Ways to improve:
- Optimize scheduling: Ensure enough agents are available to handle callbacks promptly.
- Effective management: Use a system to prioritize callbacks based on urgency and customer value.
- Follow-up efficiency: Train agents to resolve issues quickly during the callback to prevent repeat calls.
Metrics #25. Repeat call rate
The repeat call rate measures the percentage of callers who call back about the same issue within a specified period, indicating unresolved issues or dissatisfaction with the initial resolution.
Importance:
A high repeat call rate can indicate problems with first-call resolution, impacting customer satisfaction and operational efficiency. Reducing this rate is essential for improving service quality and customer loyalty.
Repeat Call Rate = (Number of repeat calls for the same issue / Total calls) * 100
If 100 of 1,000 total calls are repeat calls for the same issue, the repeat call rate is 10%, signaling a need for improvement in problem resolution.
Ways to improve
- Root cause analysis: Identify and address the underlying issues leading to repeat calls.
- Agent training: Enhance agent problem-solving skills and knowledge to ensure effective resolutions.
- Feedback loop: Implement a system for collecting and acting on customer feedback to prevent future repeat calls.
Metrics #26. Percentage of calls blocked
This metric measures the proportion of incoming calls that cannot be connected due to the call center being at capacity, leading to a busy signal or dropped call.
A high percentage of calls blocked is a critical indicator of inadequate capacity or inefficiency in call handling, which can lead to potential loss of business and diminished customer satisfaction.
Calls Blocked Percentage = (Number of calls blocked / Total incoming calls) * 100
If a call center receives 2,000 calls in a day and 200 are blocked, the percentage of blocked calls is 10%. It highlights the need for capacity planning and operational adjustments.
Ways to improve
- Capacity planning: Ensure the call center infrastructure can handle peak volumes.
- Efficiency improvements: Optimize call handling processes to reduce the duration of calls and free up lines.
- Alternate channels: Promote the use of other support channels, like chat or email, during peak times to alleviate pressure on phone lines.
Customer experience metrics
Let’s explore the crucial customer experience metrics that form the backbone of any thriving call center operation. These metrics offer a roadmap for enhancing customer satisfaction and loyalty. Understanding and improving these metrics is essential for any business looking to thrive in today’s competitive landscape.
Metrics #27. CSAT scores
Customer Satisfaction (CSAT) scores directly gauge how pleased customers are with your service or product. Calculated from surveys, these scores offer immediate feedback on customer sentiment.
High CSAT scores signify successful interactions, possibly leading to repeat business and referrals. Conversely, low scores spotlight areas for improvement, potentially affecting loyalty and revenue.
CSAT Score = (Number of Satisfied Responses / Total Responses) x 100.
For instance, if 80 out of 100 customers indicate satisfaction, your CSAT score would be 80%.
Improvement tips
- Collect feedback consistently.
- Analyze and address dissatisfaction causes.
- Enhance staff training for better customer interaction.
- Implement feedback-driven service improvements.
Metrics #28. QA scores
QA scores evaluate the quality of customer interactions against preset standards, ensuring consistent service quality and identifying areas needing attention or commendation.
They maintain high service standards, underline training needs, and recognize exemplary service, playing a pivotal role in sustaining customer satisfaction.
Improvement tips
- Define clear quality criteria.
- Regularly train and provide feedback to agents.
- Recognize and incentivize high performance.
- Continually adjust QA standards to meet customer expectations.
Metrics #29. Net promoter score (NPS)
NPS assesses customer loyalty based on their likelihood to recommend your services. It’s calculated from responses to a single question about the likelihood of recommending your business to others.
A high NPS suggests strong customer loyalty and growth potential through word-of-mouth, while a low NPS indicates areas needing improvement in customer experience.
Related read: Net Promoter Score (NPS): The definitive guide for businesses
Improvement tips
- Prioritize creating exceptional experiences.
- Quickly address detractors’ concerns.
- Engage with promoters to reinforce loyalty.
- Utilize feedback for strategic planning.
Metrics #30. Customer effort score (CES)
CES measures the ease of customer interaction with your service, reflecting the effort required to get their issues resolved or needs met.
Lower CES implies easier customer interactions, boosting satisfaction and loyalty. Higher CES may lead to customer frustration and attrition.
Related read: What is Customer Effort Score and how to improve CES?
Improvement tips
- Streamline processes to reduce customer effort.
- Implement efficient self-service options.
- Train staff for quick issue resolution.
- Act on feedback to continually refine the customer experience.
Metrics #31. First contact resolution (FCR)
FCR tracks the percentage of issues resolved upon first contact, eliminating the need for follow-ups.
High FCR rates indicate effective service, enhancing customer satisfaction. Low FCR rates may point to service inefficiencies, potentially escalating customer dissatisfaction.
Related read: First contact resolution (FCR): Benefits + how to improve
Improvement tips
- Equip agents with necessary tools and information.
- Invest in comprehensive agent training.
- Establish feedback loops for continuous improvement.
Improve your call center metrics with Yellow.ai.
Transitioning from traditional call center metrics to dynamic, customer-centric approaches requires more than just a shift in perspective; it necessitates integrating advanced technology solutions like those offered by Yellow.ai. This AI-driven platform elevates call center operations by leveraging intelligent automation and real-time analytics, thereby ensuring your metrics measure performance and actively contribute to its enhancement.
Features and benefits:
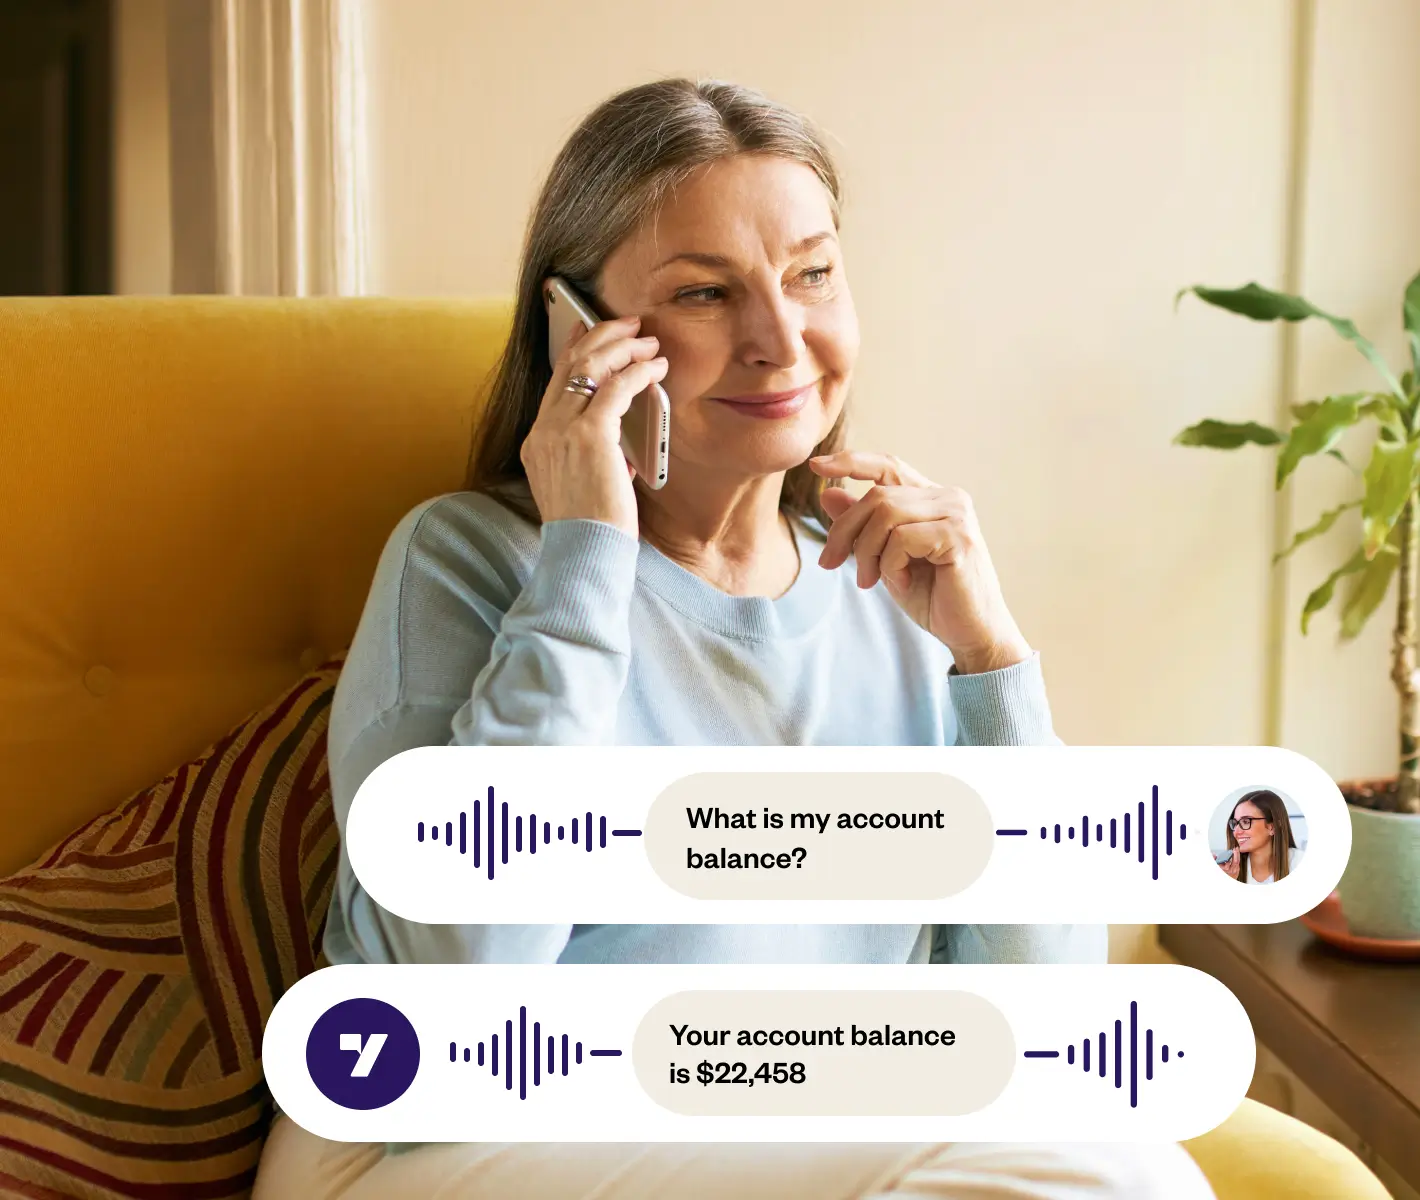
- AI-powered virtual assistants: Deploy conversational AI across voice and chat platforms to reduce wait times and improve first contact resolution rates. These assistants are capable of handling a wide range of queries, ensuring customers receive timely and accurate responses.
- Real-time analytics and insights: Yellow.ai’s analytics dashboard provides a comprehensive view of your call center’s performance. Track key metrics in real time, identify trends, and make data-driven decisions to optimize operations.
- Omnichannel support: Seamlessly integrate support across all digital channels, allowing for a consistent and unified customer experience. Besides enhancing customer satisfaction (CSAT) scores, it also contributes to a higher Net Promoter Score (NPS).
- Automated workflow management: Streamline operations with automation, from call routing to after-call work, reducing average handle time (AHT) and boosting agent productivity.
- Customizable solutions: Tailor Yellow.ai’s features to your specific call center needs, ensuring your metrics reflect the unique aspects of your service and customer interactions.
By integrating Yellow.ai’s advanced solutions into your call center operations, you’re not just tracking metrics; you’re setting new standards for excellence in customer service.
Ready to transform your call center metrics and elevate customer experience?

The final thoughts
As we close this comprehensive exploration of call center metrics, it’s clear that understanding and optimizing these indicators is crucial for any business looking to thrive in a customer-first era. But the journey doesn’t end with measurement alone; it’s about continuously adapting and improving, leveraging cutting-edge technology like Yellow.ai to exceed customer expectations.
Yellow.ai stands at the forefront of this evolution, offering tools for monitoring and solutions for enhancing every facet of call center operations. With its AI-driven approach, Yellow.ai doesn’t just change how we view metrics; it transforms the very fabric of customer service, making every interaction more meaningful, efficient, and satisfying for both customers and agents alike. As businesses, embracing these innovations is essential for staying competitive and relevant in a rapidly changing landscape. Here’s to redefining excellence in call center operations and creating experiences that customers not only remember but cherish.