










The most common advice about service quality assurance is to review more conversations and coach agents against a scorecard. That's useful, but incomplete. You can improve every agent's score while customers still struggle with broken routing, contradictory policies, and handoffs that make them start again.
A stronger program follows the customer's problem from arrival to resolution. It asks what failed, who can fix it, and whether the customer got the result they needed.
Table of Contents
- What Service Quality Assurance Means and Where It Fails
- Metrics That Track the Whole Customer Journey
- ISO 18295-2 Benchmarks for Contact Center QA
- How to Build a QA Program Step by Step
- Automated and AI-Driven QA Without Losing Control
- Governance, Reporting and Proving QA ROI
- Start With One Journey and a 90-Day Pilot
What Service Quality Assurance Means and Where It Fails
Service quality assurance is the continuous check that service delivers the outcome customers and employees expected, not merely that staff followed the script. It combines clear standards, consistent evaluation, customer feedback, and corrective action.
Consider a restaurant. The kitchen can pass a hygiene inspection while a guest waits so long for dinner that they leave unhappy. The inspection matters, but a program that checks only the kitchen misses the failure the guest experienced.
Contact centers make the same mistake when they reward correct greetings, approved phrases, and accurate case notes without checking whether the problem ended. Compliance is necessary. It isn't a substitute for effective service.
The components below help keep the program focused on delivery rather than inspection alone.
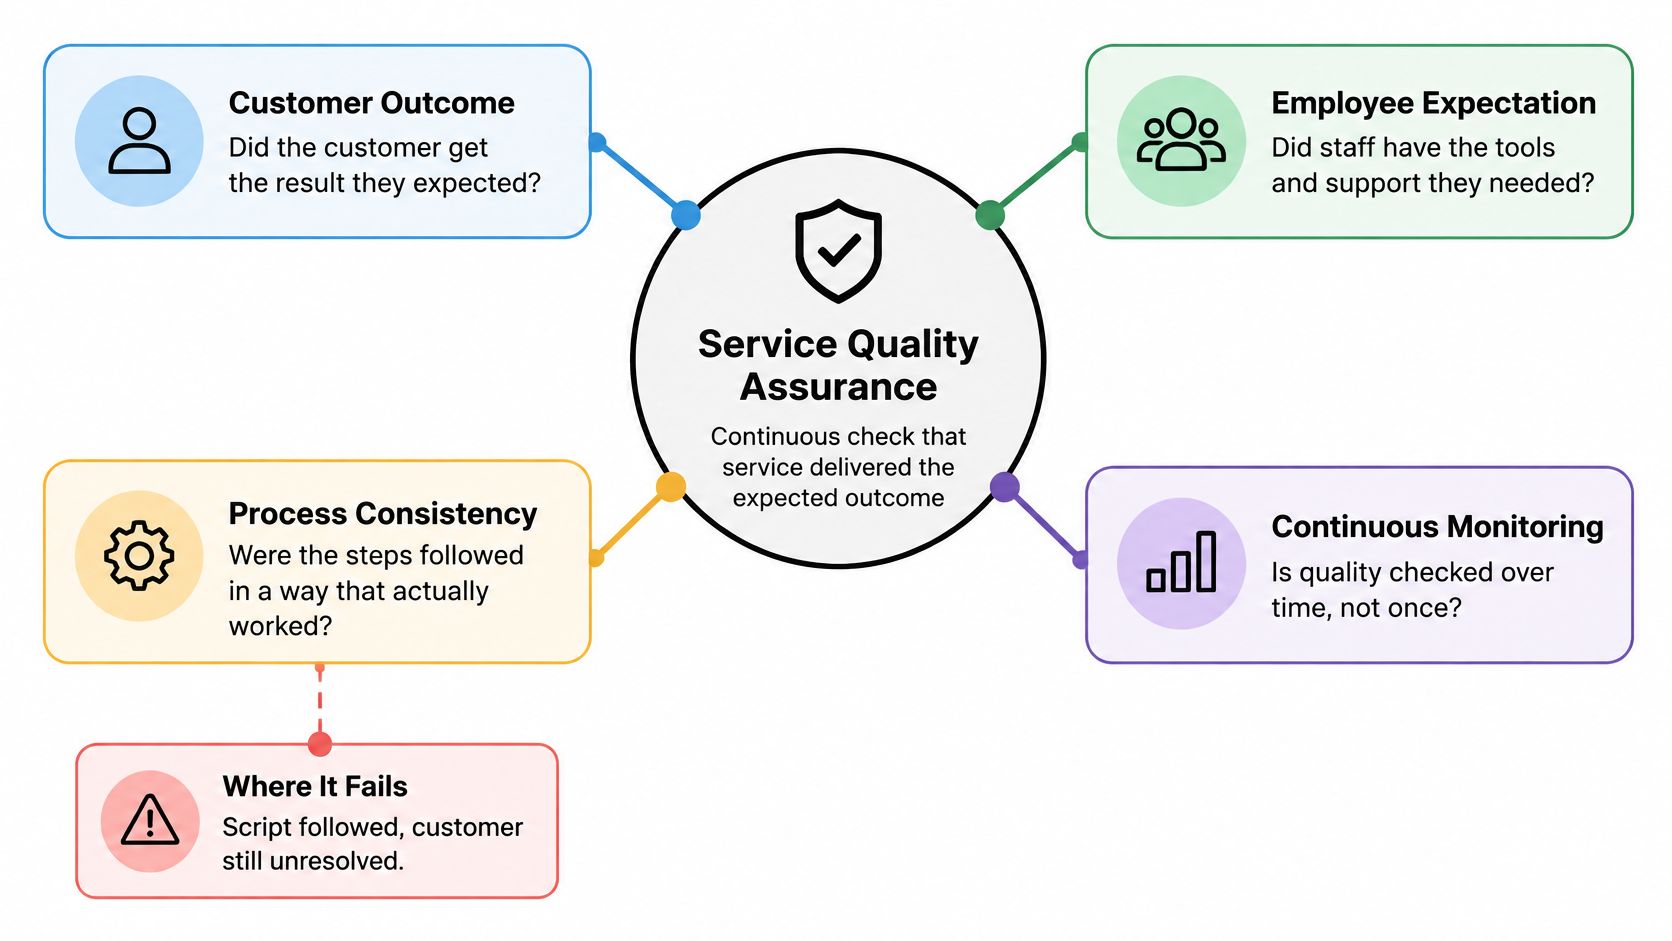
Understand the expectation gap
SERVQUAL treats quality as the gap between what customers expect and what they perceive across reliability, assurance, tangibles, empathy, and responsiveness. In a 2023 SERVQUAL application, all 28 research-service attributes and 20 community-service attributes were reported as valid and reliable, yet every expectation–perception statement showed a negative gap despite actual scores above 75%.
That finding comes from research and community services, not a contact-center benchmark. Its practical lesson still matters: favorable delivery scores don't establish that expectations were met.
The five service-quality dimensions and what QA should check
| Dimension | What customers expect | What QA checks | Example signal |
|---|---|---|---|
| Reliability | Problem solved correctly the first time | Accuracy of resolution and information given | Resolution rate by intent |
| Assurance | Confidence that the agent or bot knows the answer | Policy adherence and knowledge accuracy | Accuracy score on audited contacts |
| Tangibles | Clear, usable channels and materials | Interface clarity and channel setup | Abandonment at IVR or form steps |
| Empathy | Feeling understood and treated as an individual | Empathy markers and personalization | Empathy rating in sampled conversations |
| Responsiveness | Quick, proportionate reply | Queue time and acknowledgement time | Time to agent or to first acknowledgement |
Check the service, not just the checklist
Tangibles can confuse new QA managers because the term sounds physical. In digital service, it includes readable forms, usable interfaces, accessible messages, and instructions customers can follow.
Empathy also needs careful definition. An apology isn't enough if the agent ignores the customer's circumstances or repeats an unsuitable solution. Reviewers should look for evidence that the response changed appropriately after the customer explained their situation.
For a useful comparison outside contact centers, Arelli Cleaning's quality assurance guide provides context for thinking about QA in office cleaning. Different services need different checks, but managers still have to distinguish completing assigned tasks from delivering an acceptable result.
Start by mapping each service-quality dimension to a metric you already collect. Then identify the missing evidence, especially customer-perceived resolution and effort.
A QA score tells you what staff did. The expectation gap tells you what customers got.
Metrics That Track the Whole Customer Journey
Scoring isolated interactions misses whether a customer's problem ended. Use a layered view that connects employee or bot behavior with waiting, resolution, handoffs, and customer effort.
Journey metrics by layer, calculation and fix owner
| Metric | Layer | How to calculate it | Fix owner when it drops |
|---|---|---|---|
| Accuracy rate | Interaction | Audited answers judged correct divided by audited answers | Knowledge base or agent training |
| Policy adherence | Interaction | Required steps completed divided by applicable steps | Process owner |
| Queue-to-agent time | Operational | Median seconds from queue entry to agent connection, by channel | Staffing, IVR or routing |
| IVR abandonment | Operational | Callers who quit in the IVR divided by IVR entries | IVR design |
| First-contact resolution | Outcome | Issues closed in one contact divided by issues raised | Routing, knowledge or policy |
| Repeat-contact rate | Outcome | Same-customer, same-issue repeat contacts within the agreed observation window divided by eligible contacts | Resolution design |
| Transfers per contact | Journey | Transfers divided by contacts, by handoff path | Routing and handoffs |
| Customer effort score | Perception | Survey rating of how hard the issue was to resolve | Journey design |
The owner column means the team responsible when performance deteriorates. For waiting, abandonment, repeat contacts, and transfers, deterioration usually means the number rises, not falls. That sounds obvious, yet scorecards often mark every metric with the same red or green logic and bury the direction of harm.
Treat transfers as a journey diagnostic alongside the interaction, operational, outcome, and perception layers. A transfer can be appropriate. Its destination and context determine whether it helps: a warm handoff to the team that owns the adjustment is different from a cold bounce caused by a routing rule.
Read the measures together
Consider a hypothetical billing dispute. The agent follows every required step, gives accurate information, and records the case correctly. The customer has nevertheless repeated authentication, moved between departments, and contacted support again because nobody owned the adjustment.
The agent's interaction review looks strong. The transfer path, repeat-contact record, and effort feedback show a failed journey.
A clean interaction score works like a green light on one gauge while another gauge shows overheating. If QA only rewards the green light, it will coach the person nearest the customer and leave the policy, knowledge gap, system rule, or handoff that created the defect untouched.
This distinction matters because customer frustration is not limited to the conversation itself. In the contact-center outsourcing report, EMEA consumer findings indicate that 55% find waits exceeding 10 minutes frustrating and 41% dislike repeating information.
Use findings like these to ask sharper questions about your own journeys rather than to set universal targets: where do customers wait, what information gets lost between systems, and which steps make them repeat work already done?
Establish the measurement contract
Before comparing teams, write down what counts as a contact, an issue, a transfer, and a resolution. Decide how reopened cases, scheduled follow-ups, and contacts across channels affect each calculation. A short definition page prevents a dashboard from turning several different journeys into one misleading average.
A repeat-contact measure needs a declared observation window. If that window changes halfway through the reporting period, the apparent improvement may be a definition change rather than better service. The same risk applies when a “resolved” tag means the agent finished a task while the customer still lacks money, access, confirmation, or a working fix.
- Join the records: Use a journey or case identifier to connect conversations with CRM events and completed actions.
- Separate intended follow-up: A promised status update is not automatically evidence of failed resolution.
- Inspect channel differences: A lower voice workload may mean customers moved to chat, not that demand disappeared.
- Keep evidence accessible: Reviewers should be able to open the transcript, case history, and relevant workflow event.
For a broader operational vocabulary, use this guide to contact-center metrics. When workflows carry documented obligations, the discipline used to track compliance in case management maps cleanly to service QA: record whether required actions happened, then separately establish whether the case reached its intended outcome.
For each journey, pair an outcome measure with an interaction measure. Before coaching an agent, inspect the associated policy, system behavior, knowledge record, and handoff rule. Otherwise, you may coach someone to work around a defect another team should remove.
ISO 18295-2 Benchmarks for Contact Center QA
ISO 18295-2 is a practical external reference for inbound service quality in both in-house and outsourced contact centers. It connects service promises to customers' channel-specific tolerance for waiting and the resources needed to meet those promises.
The best-practice recommendation in ISO 18295-2 is to connect customers to an agent within 1 minute after queue entry and IVR completion, or offer a callback option. In an AI-assisted journey, a fast automated acknowledgement doesn't establish that the customer received timely help.
The standard also calls for appropriate acknowledgement of digital interactions. That doesn't mean email, chat, and voice should share an identical response-time target.
Translate the benchmark into observable events
A single average response-time figure can conceal a slow voice queue behind quick chatbot acknowledgements. Separate the journey into stages and define the timestamp for each stage before building the dashboard.
| Operational measure | What the QA manager should inspect |
|---|---|
| Queue-entry-to-agent connection | Whether customers reach a suitable agent within the channel's service target |
| IVR abandonment | Whether customers leave before completing navigation |
| Callback completion | Whether the promised callback happens and reaches the customer |
| Digital acknowledgement time | Whether the customer receives a timely, useful confirmation |
| Resolution by intent and segment | Whether service speed leads to an effective result |
Keep callback acceptance separate from callback completion. Offering the option creates a promise; completing it fulfills the promise.
The same distinction applies to digital acknowledgements. A message that confirms receipt should explain what happens next and how the customer can follow progress. An instant receipt followed by silence is not effective responsiveness.
Diagnose the funnel before assigning blame
Suppose customers abandon a support journey before an agent answers. Listening to agent calls won't explain the missing customers because those customers never reached the recorded conversation.
Instead, trace the sequence:
- Capacity planning: Compare arrivals and available staffing during the affected periods.
- IVR design: Check whether navigation matches the customer's reason for contacting you.
- Routing: Look for queues that receive unsuitable work or lack appropriately skilled coverage.
- Agent execution: Review handling only after confirming the agent received the right work and usable context.
Poor staffing or routing increases waiting. Customers may then abandon and try again through another channel, adding demand that looks unrelated unless the records are joined.
Use a documented service-level agreement calculation to make the reporting consistent, but don't confuse the formula with the service promise. Define which events start and stop the clock, how abandons are treated, and who owns missed targets.
Map each relevant ISO element to a scorecard line, an operational measure, and an accountable team. That makes the standard usable without pretending that a timing benchmark alone proves overall quality.
How to Build a QA Program Step by Step
Build a QA program around observable outcomes, accountable owners, and a repeatable review cycle. Starting with a software purchase or a lengthy scorecard usually leaves those decisions unresolved.
Use the workflow below as a map, then adapt the review mechanics to your journeys and risks.
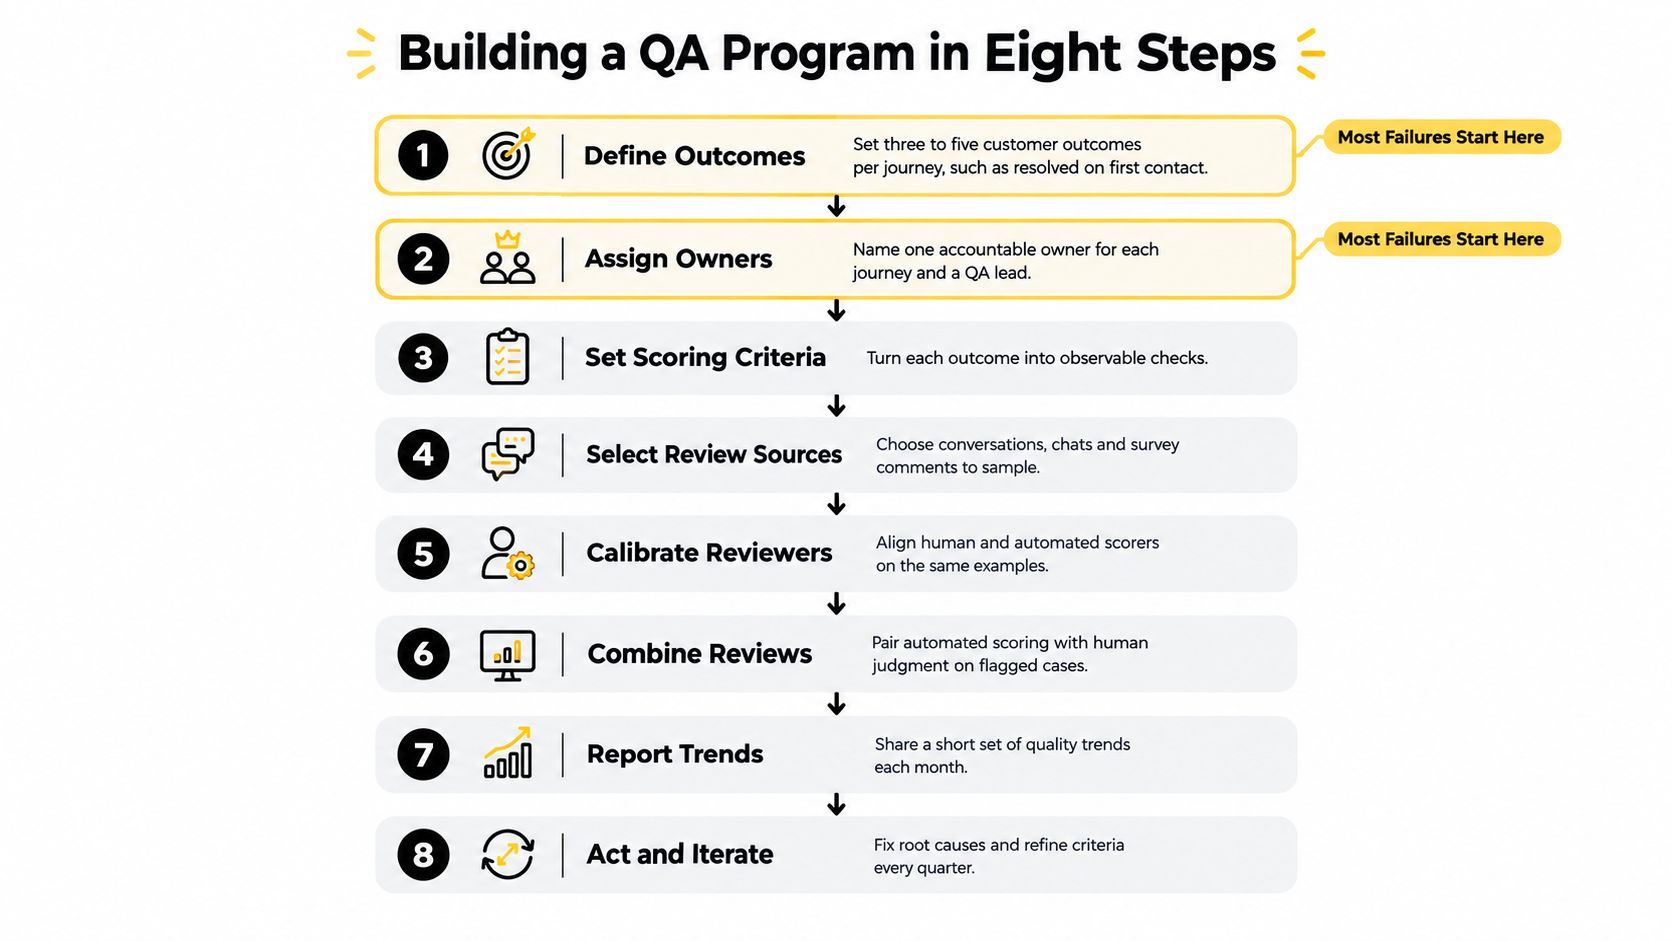
Establish what reviewers will judge
Define outcomes and assign ownership. Describe what successful service looks like: the issue is resolved, authentication isn't unnecessarily repeated, and the receiving team has the context it needs. Name a journey owner who can coordinate changes across departments. The common mistake is defining quality entirely through agent behaviors.
Build observable scoring criteria. Replace “showed empathy” with checks such as “acknowledged the customer's stated constraint and adapted the proposed action.” Weight accuracy, required controls, resolution, empathy, and effort according to risk. Don't let polished language compensate for an incorrect answer or a serious control failure.
Design the sample before reviewing. Draw a routine sample across intents, channels, languages, shifts, and employee or AI workflows, then add targeted reviews of escalations and complaints. Keep the routine and targeted results distinguishable. Otherwise, reviewing more difficult cases can make quality appear to fall even when underlying performance hasn't changed.
Calibrate reviewers using shared cases. Have reviewers score the same material independently, compare the evidence behind their decisions, and resolve ambiguous criteria. Save agreed examples as a reference library. Don't settle disagreements by averaging scores when the underlying problem is an unclear rule.
A small scorecard that reviewers apply consistently is more useful than an elaborate scorecard they interpret differently. Include an appeal route so employees can challenge missing context or factual errors without turning every review into a negotiation.
Turn review findings into changes
Tag defects by cause. Use person, policy, system, knowledge, and handoff categories, with a primary cause and contributing causes where needed. If an agent searches the approved knowledge base and finds an outdated refund rule, tag the knowledge defect rather than assuming a training failure. Record the evidence supporting the attribution.
Pair evaluations with customer feedback. Ask whether the issue was resolved and how difficult the process felt, then connect responses to the relevant journey. Read comments alongside scores. Don't assume customers who didn't answer the survey had a satisfactory experience.
Set an action cadence. Keep coaching close enough to the interaction that the employee can remember it, and give recurring systemic defects a formal review with their owners. Maintain a change log when criteria or workflows change. A dashboard without assigned actions is just a record of unresolved problems.
Pilot before expanding. Test the program on a bounded journey with clear entry and completion events. Confirm that reviewers can find evidence, owners accept defects, and changes can be measured. Expanding before those mechanics work spreads inconsistent scoring across more teams.
Choose tools that preserve evidence
Before selecting a QA tool, test whether it can ingest voice, chat, email, and CRM events under a shared journey identifier. Require exports that let analysts join evaluation results to resolution data, plus access controls and retention settings appropriate to the information reviewed.
Score the employee experience too. Track knowledge-search failures, agent-assist accuracy, and after-call work, with an EX lead helping interpret the results. A slow knowledge lookup may reflect search design, permissions, or content structure rather than employee ability.
Practical rule: Don't send a defect to coaching until you can describe the behavior the employee could reasonably have changed.
Use the video below as a discussion prompt when aligning the team on review and improvement practices.
The practical outputs are straightforward: an approved scorecard, a documented sampling plan, a calibration record, and a defect log with owners and due dates. Those are the operating tools that make service quality assurance repeatable.
Automated and AI-Driven QA Without Losing Control
Automated scoring can appear complete while missing customers who abandoned before a conversation began. Reviewing everything your system recorded isn't the same as measuring everyone who tried to get help.
The governance gap deserves attention. In the Conviva State of Digital Experience report, 80% of organizations report at least partial AI implementation, while 67% say they're still implementing AI without adequate governance structures.
Human review remains part of the operating model, particularly where an incorrect response can change a customer's finances, access, or account.

Match assurance to the consequences
Risk tiers should reflect the action an agent can take, not merely the topic it discusses. Explaining a payment policy and initiating a payment shouldn't automatically receive the same assurance treatment.
The following is a proposed operating model, not a universal testing standard.
Risk-tiered QA model for automated and AI-driven service
| Risk tier | Example intents | Automated check | Human review | Release gate |
|---|---|---|---|---|
| High impact | Payments, account changes, eligibility decisions | Full scenario suite on every release across supported languages | Recurring sample plus every escalation | Block until tests pass and an authorized reviewer signs off |
| Medium | Order status, bookings, plan changes | Scenario tests per channel and language | Random sample plus exception review | Pass threshold agreed before testing |
| Low | FAQs, store hours, policy lookups | Regression tests on each knowledge update | Periodic random sample | Automatic release only when approved checks pass |
| Any tier, low confidence or escalated | Cases flagged by uncertainty or handoff | Log context, abstention and handoff quality | Review every flagged case promptly | Feed findings into root-cause correction and release decisions |
A confidence signal is useful for triage, but it isn't proof of correctness. An AI agent can give an unsupported answer confidently, so reviewers also need evidence-based checks.
For insurance teams identifying suitable workflows, the directory of verified customer service cases for insurers can provide use-case context. Each proposed workflow still needs its own assessment of permissions, consequences, and escalation requirements.
Test the failure behavior
Accuracy testing asks whether the answer was correct. Governance also asks what the agent did when the answer wasn't available.
- Groundedness: Can the response be supported by approved, current information?
- Abstention: Does the agent decline unsupported requests without inventing an answer?
- Transfer quality: Does the receiving person get the customer's intent, completed checks, and unresolved task?
- Unequal outcomes: Do language or accessibility needs change completion, escalation, or error patterns?
- Action safety: Does the agent verify permissions before changing a record or triggering a transaction?
Yellow.ai's Automated Testing and analytics are one option alongside manual scenario reviews and independent test harnesses for checking conversational behavior and investigating failures. The risk model, not the tool's coverage claim, determines where human approval remains necessary.
Design human-in-the-loop automation around explicit intervention conditions. “Ask a person when needed” is too vague to test.
Link incidents to the model, prompt, retrieval content, tool configuration, or workflow version involved. Preserve the triggering input and expected behavior so the correction becomes a regression test rather than a temporary workaround.
Governance, Reporting and Proving QA ROI
A QA business case should translate a specific operational improvement into a defensible financial result. Start with avoided work you can measure, not an assumed increase in loyalty.
Consider a hypothetical planning example, not an industry benchmark: a center handles 50,000 monthly contacts, its measured repeat-contact rate falls from 18% to 12%, its blended handling cost is $6 per contact, and its annual QA program costs $180,000. The calculation below holds the contact-volume base constant to isolate the assumed reduction.
Worked annual ROI example for a QA program
| Line item | Assumption | Annual value |
|---|---|---|
| Repeat contacts avoided | 50,000 monthly contacts × (18% − 12%) × 12 months | 36,000 contacts |
| Avoided handling cost | 36,000 avoided contacts × $6 | $216,000 |
| Program cost | Annual cost of the hypothetical QA program | $180,000 |
| Net benefit | $216,000 avoided cost − $180,000 program cost | $36,000 |
| Return on program cost | $36,000 ÷ $180,000 | 20% |
These are illustrative assumptions and arithmetic, not a forecast. They exclude retention gains and compliance savings because those require separate evidence.
Avoided handling cost also isn't automatically cash savings. Finance should distinguish released capacity from reduced expenditure, and confirm whether the operation actually avoided overtime, hiring, outsourcing charges, or other costs.
The illustration below uses a separate hypothetical trend to show how a reporting pack can connect operational change with accountable ownership.
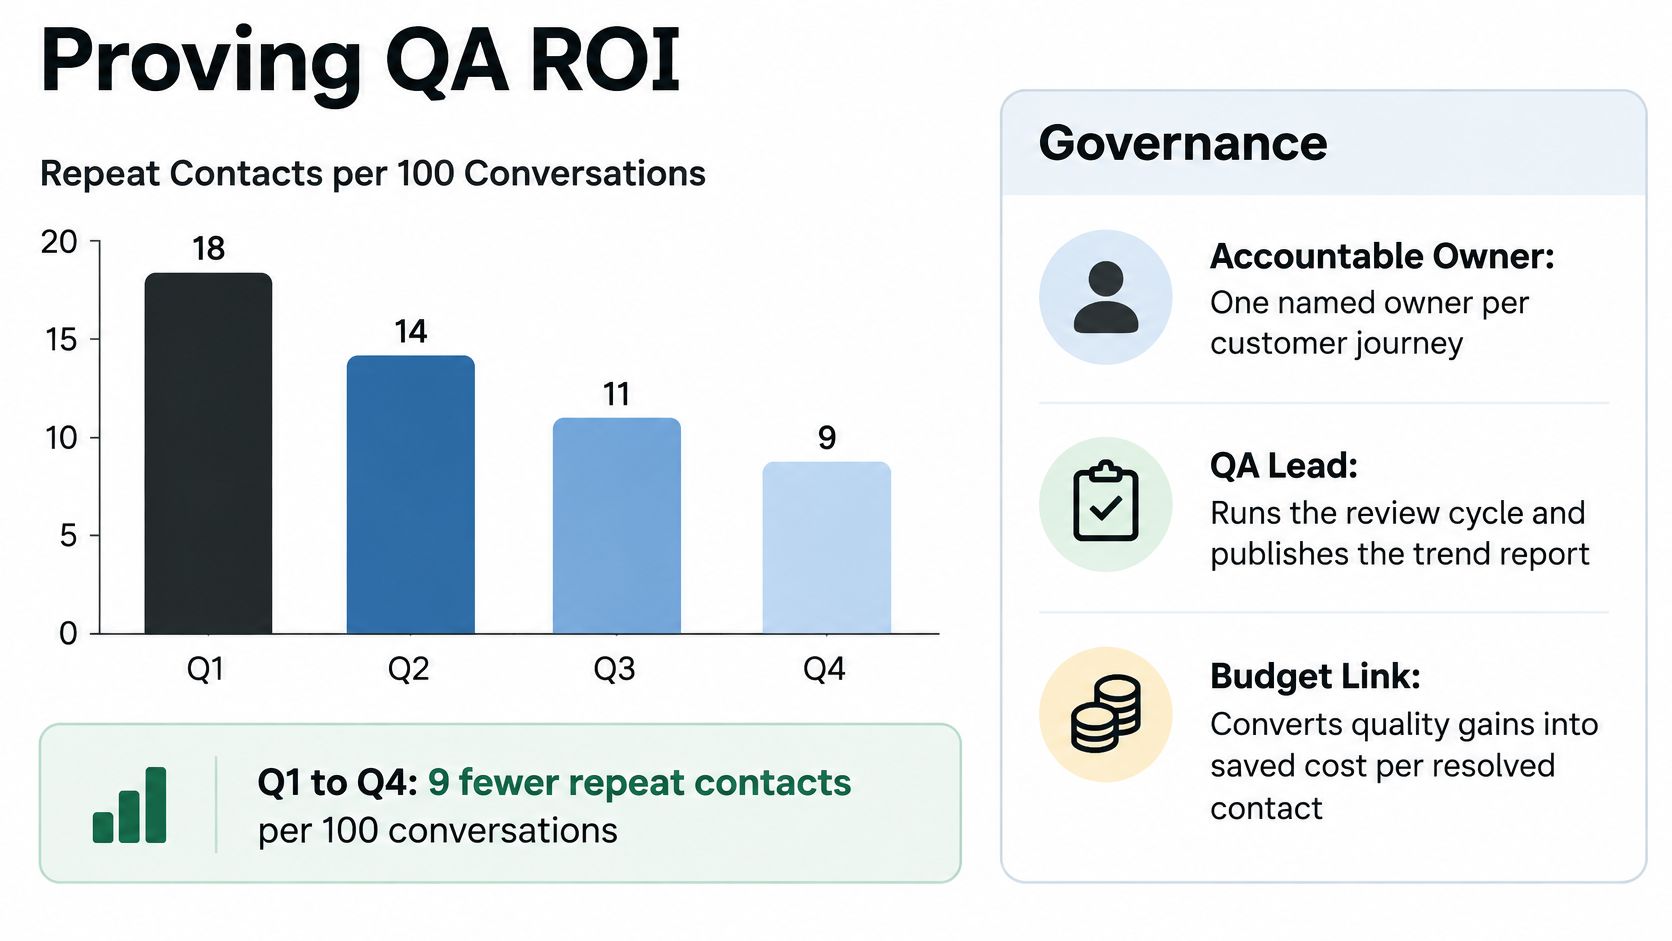
Give decision rights to named people
The journey owner is accountable for results across teams. The QA lead controls evaluation definitions, calibration, and scorecard versions. A change group approves material scorecard revisions and AI release decisions, with operations, technology, and risk represented as appropriate.
Those roles prevent a familiar stalemate: QA identifies a recurring defect, operations asks technology to fix it, and technology waits for a policy decision nobody owns.
Finance check: Count a benefit only when you can explain the baseline, the operational change, and the route from that change to saved cost.
Keep the reporting pack short
Use a compact executive view: first-contact resolution, repeat-contact rate, transfers per contact, customer effort, and defect rate by root cause. Show the trend, accountable owner, and corrective action beside each measure.
Put diagnostic details in supporting views rather than crowding the main report. Leaders need to know whether service improved, where the remaining failure sits, and what decision they must make.
Before claiming a benefit, check for changes in demand mix, outages, product releases, staffing, and channel migration. A decline in repeat contacts during a quieter period doesn't by itself establish that QA caused the improvement.
For every reported metric, maintain:
- Data source: The system and records used to produce it.
- Definition: Eligibility rules, exclusions, observation window, and calculation.
- Owner: The person responsible for interpretation and action.
- Refresh frequency: When the measure updates and when it becomes reliable enough to use.
Lock those definitions before the baseline. Otherwise, an apparently precise ROI calculation may rest on incomparable measurements.
Start With One Journey and a 90-Day Pilot
Start with a high-volume journey that has recognizable entry and completion events, not the entire contact center. Choose something operations can change, such as a refund request, delivery exception, or employee access request.
Treat the 90-day pilot as a proposed implementation window, not a promise of a particular result. Its purpose is to test whether your team can measure consistently, identify causes, and verify corrections.
Use phases with clear exit decisions
- Baseline and align: Save the existing outcome measures, check event completeness, and have reviewers independently evaluate shared cases. Don't begin performance comparisons while they still disagree about what the criteria mean.
- Run and classify: Apply the scorecard, preserve supporting evidence, and assign every actionable defect to an owner. Keep targeted exception reviews separate from routine sampling.
- Correct and retest: Fix the root causes with the greatest customer impact and repeatability. A knowledge correction needs content validation; a routing change needs end-to-end handoff testing.
- Evaluate and decide: Compare results with the baseline, inspect channel and customer-segment differences, and confirm that apparent improvements survived operational changes.
Don't spend the entire pilot scoring. Reserve enough time for owners to implement corrections and for customers to experience the changed workflow.
Scale only when the evidence holds
Expand when repeat-contact performance improves against a stable baseline, reviewers apply criteria consistently, and AI workflows show no unexplained deterioration. Require evidence that the improvement applies to the intended journey rather than an unusually easy sample.
Pause if one channel improves while another worsens. Inspect whether the change moved work, delayed escalation, or made customers switch channels instead of resolving their issue.
Automated testing and analytics can broaden scenario coverage across voice, chat, and email. Judge those tools by whether they help your team reproduce defects and improve journey outcomes, not by the volume of scores displayed.
Before launch, confirm the essentials:
- Owner named: Someone can authorize and coordinate changes.
- Baseline saved: Definitions and supporting records are preserved.
- Scorecard approved: Reviewers and employees understand the criteria.
- Sampling set: Routine and targeted reviews have documented selection rules.
- Root-cause review booked: Defect owners have a scheduled decision forum.
A successful pilot leaves behind more than improved scores. It leaves a working method for finding failures, assigning responsibility fairly, and proving that the correction helped customers.
Yellow.ai offers enterprise AI agents, automated testing, and analytics for customer and employee service workflows. Visit Yellow.ai to explore how these capabilities could support journey-level assurance, controlled releases, and evidence-based improvement in your service operation.