










Twenty-three percent of contact center leaders struggle to translate metric data into actionable insights, according to ICMI's recent industry coverage. That figure reframes the problem. Most large service organizations don't lack dashboards, reports, or historical data. They struggle to decide which signal matters, what caused it, and which operational change will improve the customer outcome without creating a new failure elsewhere.
Contact center metrics work only when leaders connect measurement to decisions. A lower average handle time can indicate better workflows, or it can mean agents are rushing customers off the phone. A higher containment rate can show effective self-service, or it can hide frustrated customers who abandon an automated journey and call again. The discipline has moved beyond counting contacts. It now requires a balanced view of speed, quality, customer effort, workforce health, and resolution value across voice, chat, email, self-service, and AI-assisted interactions.
Table of Contents
- The Shift in Contact Center Measurement
- Categorizing Contact Center KPIs
- Core Operational Efficiency Metrics
- Customer-Centric Resolution Metrics
- Agent Engagement and Workforce Health
- The New Era of Outcome-Based Metrics
- Mapping Metrics to Customer Experience Outcomes
- Building a Balanced Performance Scorecard
- Industry-Specific Benchmarks and Targets
- Strategic Implementation and Continuous Improvement
The Shift in Contact Center Measurement
The modern contact center inherits a measurement model built around operational throughput. ICMI's earlier benchmark guide found that service level and response time were measured by 95% of contact centers, while the number of contacts handled was measured by 89%. Quality, customer satisfaction, and first contact resolution were also widely tracked, at 88%, 87%, and 73% respectively, as reported in the ICMI metrics guide.
Those figures show a mature discipline, but they also reveal an old operating assumption. Leaders measured what was easy to count, especially calls answered, response speed, and workload. That approach became inadequate as channels diversified. The same ICMI guide recorded inbound phone, email, web or online self-service, IVR self-service, and online chat as established service channels, making a single voice-centric dashboard an incomplete view of demand and performance.

From collection to interpretation
Recent ICMI data shows that abandonment rate and average handle time remain among the most commonly measured metrics, at 85% and 84%, followed by quality at 77%, average speed of answer at 76%, and agent productivity at 74%. Those measures remain useful. The failure occurs when managers treat them as conclusions rather than diagnostic clues.
A dashboard should answer three questions:
- What changed? Identify the movement in a KPI by channel, queue, intent, customer segment, and time period.
- Why did it change? Connect the movement to staffing, routing, product defects, policy changes, demand mix, or agent workflow.
- What should happen next? Assign an owner, define an intervention, and monitor whether the customer outcome improves.
Practical rule: A metric isn't actionable until someone can name the operational decision it should change.
The strongest centers don't eliminate classic KPIs. They place them inside a wider system. Speed measures access, quality measures interaction standards, resolution measures effectiveness, and outcome metrics test whether automation or human effort created value. That distinction prevents leaders from optimizing a local number while degrading the entire customer journey.
Categorizing Contact Center KPIs
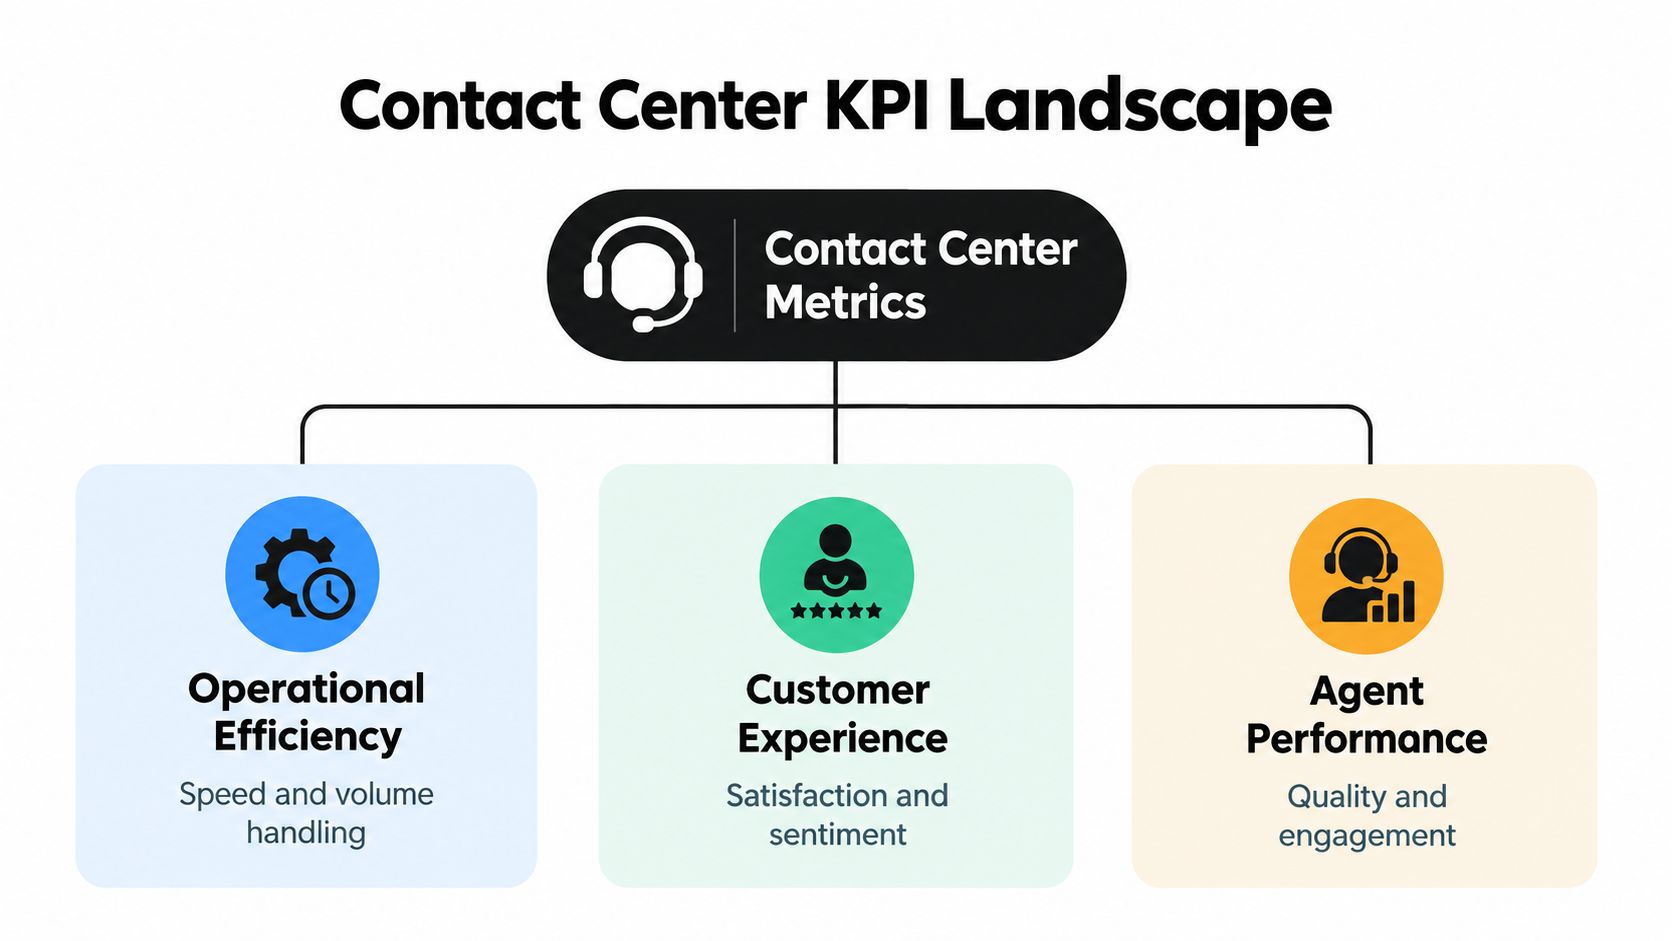
A useful KPI architecture starts with four categories, not a long list of disconnected measures. Each category answers a different management question, and the categories must be interpreted together.
Operational efficiency
These metrics show how the operation absorbs demand. Average handle time, average speed of answer, service level, abandonment rate, occupancy, and cost per interaction belong here. They help workforce managers detect capacity gaps, routing problems, queue congestion, and unnecessary process friction.
Efficiency is not the same as speed. A center can improve its service level by adding capacity, deflecting demand, or changing queue priorities. Each choice has different implications for cost and customer effort, so leaders need the underlying driver rather than a headline number.
Customer experience
Customer experience measures how customers perceive the interaction and whether they received a complete solution. CSAT, customer effort score, NPS, repeat contact rate, quality, and first contact resolution provide that view.
These measures need context. A satisfied customer after a long interaction may indicate effective empathy and resolution, while a fast interaction with a repeat contact may indicate an incomplete answer. For a compact reference to common service measures, the guida ai KPI del customer service offers another useful KPI map.
Agent performance and business outcomes
Agent metrics include schedule adherence, utilization, quality, productivity, coaching progress, and agent satisfaction. They show whether people have the capacity, tools, and support to deliver the intended experience.
Business outcomes connect service activity to commercial or organizational value. Examples include retention, revenue protection, complaint reduction, cost per resolution, and successful completion of a customer goal. Keeping these categories separate in reporting but connected in analysis prevents a productivity target from overpowering quality or employee health.
Core Operational Efficiency Metrics
Operational metrics show whether demand, staffing, routing, and workflow are aligned. They help leaders locate pressure in the system, but they do not prove that customers received a complete solution. Use them to diagnose operating conditions, then connect them to quality and resolution outcomes.
Average handle time
Average handle time, or AHT, is calculated as:
AHT = (talk time + hold time + after-call work) / handled interactions
Industry references place typical AHT at roughly 6 to 10 minutes, depending on sector and methodology, as summarized in call center benchmark guidance from LiveAgent. That range provides context, not a universal target. A complex financial complaint and a simple delivery question require different handling expectations.
AHT becomes harmful when managers rank agents on it alone. Agents may shorten conversations, transfer difficult cases, or close interactions before the customer has a complete answer. Pair AHT with quality, repeat contact, and resolution data. If AHT falls while repeat contacts rise, the operation has shifted work from the current interaction into the customer's next one.
First contact resolution
FCR = contacts resolved during the first interaction / total resolved contacts
SQM's historical guidance places the global average FCR at about 70%, with 70% to 79% considered good and 80% or higher described as world-class. SQM also states that only around 5% of call centers reach that world-class level, as cited in the LiveAgent statistics referenced above. The comparison is useful only when “resolved” has a consistent definition and repeat contacts are checked across channels.
FCR also exposes limits in staffing and agent authority. A low result may reflect incomplete knowledge, restrictive policies, unnecessary transfers, or products that generate avoidable demand. The metric needs a reason code, not just a score.
Service level and ASA
Service level = interactions answered within the threshold / offered interactions
The widely used convention is to answer 80% of inbound calls within 20 seconds, as described in Salesforce's contact center metrics guidance. Average speed of answer, or ASA, measures the average queue time for answered calls. Service level shows how consistently the operation meets its response promise, while ASA describes the average waiting experience.
Abandonment rate
Abandonment rate = callers who disconnect before answer / offered calls
A rising abandonment rate can indicate insufficient staffing, long routing paths, poor IVR design, or a demand spike. It can also reflect customers choosing self-service or callback. Review abandonment by queue, intent, wait time, and outcome before changing schedules or capacity.
Use the metrics together. A service-level miss with stable demand points toward capacity or scheduling trouble. Stable service level with worsening FCR points toward resolution, policy, or knowledge problems. The operating pattern matters more than any isolated number.
Customer-Centric Resolution Metrics
Speed answers the question, “How quickly did we engage?” Resolution metrics answer the more important question, “Did the customer have to come back?”
First contact resolution is the anchor. A high FCR generally means the center solved the issue without a follow-up, transfer, or escalation. SQM's benchmark framework makes FCR a useful comparison point because it combines customer effort with operational efficiency. Every unresolved interaction can create more demand, more handling cost, and another opportunity for frustration.
Measure effort across the journey
Repeat contact rate should be tracked by reason, channel, product, and agent workflow. A high aggregate rate tells you that something is wrong, but it doesn't tell you whether customers lack information, agents lack authority, the product is defective, or the automation is misclassifying intent.
Customer effort score adds the customer's perspective. Ask whether completing the task was easy, then connect the response to transfers, authentication, holds, and follow-up contacts. A customer may rate an interaction positively because an agent was courteous while still reporting high effort because the customer had to repeat information across several handoffs.
Self-service can reduce effort when it resolves a clear, bounded need. It increases effort when the customer must move through irrelevant menus, repeat a failed attempt, or explain the entire history to a human agent. Guidance on this operating model is available in Yellow.ai's whitepaper on self-service in customer service.
Judge escalation by effectiveness
Escalation isn't automatically a failure. Complex cases often need specialist judgment, approval, or investigation. The useful measure is effective escalation, which asks whether the handoff reached the right team with the right context and produced a complete resolution.
Track the reason for escalation, information transferred, time to ownership, and whether the customer had to repeat details. That combination distinguishes a deliberate specialist handoff from a routing failure. Leaders should reward complete resolution, not merely low escalation volume.
Agent Engagement and Workforce Health
Agent metrics are operational sensors. They show whether the workforce can sustain the service promise under real demand, and they often expose risk before customer scores deteriorate.
Agent utilization measures how much of available time agents spend on productive work. High utilization can indicate healthy demand alignment, but sustained intensity leaves little room for recovery, coaching, learning, or unexpected complexity. Low utilization may indicate overstaffing, poor forecasting, or excessive offline work. Neither direction is automatically good.
Read schedule adherence in context
Schedule adherence compares planned activities with actual availability. A team can have enough paid hours on paper and still miss service targets if agents are offline during the specific intervals when demand arrives. Review adherence alongside arrival patterns, shrinkage, meeting schedules, training, and absence data.
Shrinkage includes time unavailable for direct service, such as breaks, training, leave, meetings, and administrative work. Leaders who exclude it from workforce planning create a false capacity picture. The result is predictable: queues grow, agents feel pressured, and managers respond with more monitoring instead of better planning.
Treat satisfaction as a leading indicator
Agent satisfaction and agent effort reveal whether employees can do good work without fighting the system. Ask agents where they lose time, which tools create duplicate entry, and which policies force unnecessary transfers. Then compare those responses with AHT, quality, repeat contact, and schedule adherence.
The Yellow.ai employee experience AI resource describes an automation approach for employee-facing support. Whatever platform an organization uses, the operational test is the same: does it remove friction from routine work while preserving human judgment for exceptions?
Burnout rarely appears first as a resignation. It often appears as slower recovery, weaker documentation, lower empathy, and rising avoidance of difficult cases.
A healthy scorecard treats agent satisfaction as a performance variable, not an HR footnote. Coaching quality, realistic schedules, usable knowledge, and fair measurement influence the experience customers receive.
The New Era of Outcome-Based Metrics
Traditional KPIs count activity. Modern contact center metrics must evaluate whether the activity created a useful outcome.
An AI system can handle a large interaction volume and still fail if it misunderstands intent, repeats irrelevant answers, or hands customers to human agents without context. Conversely, a well-designed automated journey may resolve a routine request without generating a conventional agent interaction at all. Counting human-handled contacts alone would make that success invisible.

Measure AI resolution, not just containment
AI resolution rate asks whether the AI completed the customer's intended task successfully, without a later repeat contact or avoidable escalation. Containment quality adds a quality test to containment. It distinguishes a fully completed interaction from a customer who stopped responding because the conversation became unproductive.
Handoff efficiency measures what happens when AI transfers an interaction. The receiving agent should get intent, authentication status, conversation history, relevant data, and the reason for escalation. A handoff that preserves context can add value. A handoff that forces repetition merely moves the failure downstream.
Recent ICMI coverage reports that 23% of leaders struggle to translate metric data into actionable insights, roughly a third say some metrics create mixed or counterproductive behavior, and only 29% rank forecast accuracy among their most valued metrics. These findings support a practical conclusion: the problem isn't a shortage of measures. It's the absence of a clear link between measures and decisions.
A separate Natterbox benchmark report found hunting time fell 54% year on year, from 5.15 minutes in 2024 to 2.37 minutes in 2025, while voice call volume rose 16.1% and connection rate improved from 52.5% to 60.6%. Those figures illustrate why routing and access deserve attention even as AI changes the interaction model.
A useful AI dashboard combines resolution quality, effective escalation, suggestion adoption, intent accuracy, customer sentiment, and human-agent value. The aim isn't to suppress human involvement. It's to reserve human effort for work where judgment, empathy, or authority materially improves the result.
Mapping Metrics to Customer Experience Outcomes
A KPI becomes strategically useful when leaders can trace its effect through the customer journey. The chain usually runs from an operational condition to a customer perception, then to a business outcome.
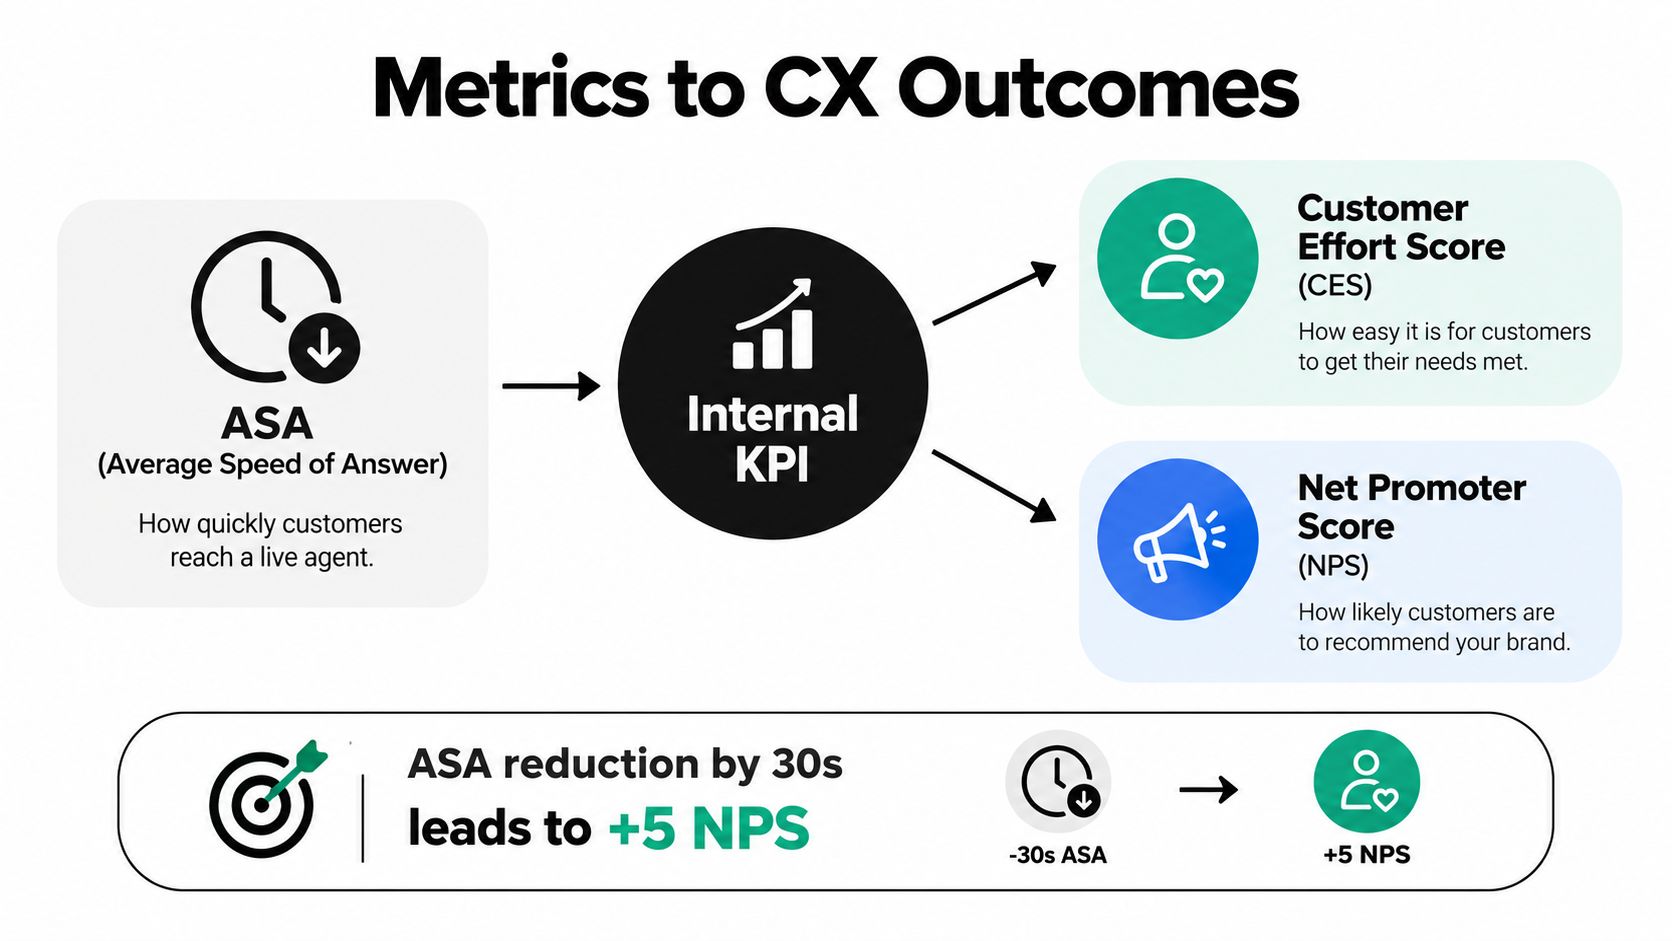
A long ASA increases waiting effort. Waiting may reduce patience before the conversation begins, especially when the customer has already tried self-service or another channel. Better staffing, routing, or callback design can reduce access friction, but leaders should verify the effect through customer effort, CSAT, repeat contact, and resolution data rather than assuming that faster answer time automatically improves loyalty.
Use causal links carefully
FCR connects more directly to customer effort because it measures whether the customer needed another interaction. A complete first response can reduce repeated explanations and free capacity for new demand. The business value may appear as lower repeat workload, stronger satisfaction, or improved retention, but the organization must test the relationship by reason and customer segment.
The supplied visual includes a specific claim that a 30-second ASA reduction leads to a five-point NPS increase. That claim isn't supported by the verified evidence provided here, so it shouldn't be used as a universal planning assumption. Treat any causal relationship between ASA and NPS as a hypothesis that requires local analysis.
Choose the metric that matches the goal
| Business priority | Leading indicators | Outcome checks |
|---|---|---|
| Reduce cost | AHT, automation rate, utilization | Cost per resolution, repeat contact |
| Improve access | ASA, service level, abandonment | Customer effort, completion rate |
| Increase resolution | FCR, transfer rate, knowledge use | Repeat contact, satisfaction |
| Protect experience | Quality, sentiment, escalation quality | CSAT, complaints, retention |
| Improve AI value | AI resolution, containment quality, handoff efficiency | Recontact, human-agent value |
The table is a starting point, not a substitute for diagnosis. If cost reduction lowers AHT but increases repeat contacts, the operation hasn't reduced cost. It has deferred work. If automation increases containment but lowers completion quality, the organization has improved a dashboard number while worsening the customer journey.
Building a Balanced Performance Scorecard
A balanced scorecard prevents one target from dominating the operation. Benchmarking frameworks commonly group contact center performance into price, quality, productivity, agent, and service-level dimensions, including measures such as ASA, voice or customer satisfaction, net FCR, utilization, and agent job satisfaction, as described in MetricNet's benchmarking framework.
Build the scorecard around decisions
Start with the business promise. If the center handles urgent support, access and resolution may carry more weight than raw productivity. If it handles routine transactions, automation completion and cost per resolution may deserve greater attention. Select a small number of primary measures, then add diagnostic measures that explain movement.
A practical scorecard should include:
- Access: service level, ASA, abandonment, and callback completion.
- Resolution: FCR, repeat contact, transfer quality, and escalation outcome.
- Experience: CSAT, customer effort, sentiment, and quality.
- Workforce: adherence, utilization, schedule health, and agent satisfaction.
- Value: cost per resolution, automation success, and customer goal completion.
Define each metric's formula, inclusion rules, owner, review cadence, and action threshold. Without those controls, two teams can report different results under the same label.
Use tools such as Yellow.ai's AI analytics platform to bring operational and conversational signals into a shared view, but don't confuse dashboard availability with management maturity. The scorecard matters only when team leaders review it with agents, investigate root causes, and assign corrective work.
Scorecard discipline: Every primary KPI needs a balancing measure. Pair speed with resolution, productivity with quality, and automation with customer effort.
Industry-Specific Benchmarks and Targets
Industry benchmarks provide context, but targets should reflect the service promise, customer risk, and operating model. A retail center handling predictable, high-volume requests may prioritize quick access and efficient automation. Healthcare support may give greater weight to accurate resolution, privacy, empathy, and safe escalation. Financial services often balance response speed with authentication, compliance, and dispute quality.
Intent matters just as much. Billing questions, fraud concerns, clinical scheduling requests, and product complaints carry different complexity and consequences. A single blended average can conceal the queues, workflows, and coaching decisions that require attention.
Use benchmarks as guardrails
The 80/20 service-level convention, answering 80% of inbound calls within 20 seconds, offers a familiar starting reference, as described in the Salesforce guidance cited in the Core Operational Efficiency Metrics section. It should remain a guardrail, not an automatic operating target. Customer expectations, regulatory duties, queue economics, and the cost of staffing all affect the appropriate threshold.
FCR also needs contextual comparison. Earlier industry guidance places overall FCR targets in the 70% to 75% range, with approximately 75% referenced for financial services and 80% for healthcare. These figures provide directional context. They do not establish a universal promise for every intent, channel, or customer group.
Set targets by risk and effort
Set targets according to five practical questions:
- Customer consequence: What happens if the answer is wrong or delayed?
- Interaction complexity: How much investigation, authentication, or specialist input does resolution require?
- Channel role: Should voice handle urgent exceptions while self-service manages routine requests?
- Regulatory exposure: Which interactions require documented controls or human review?
- Workforce reality: Can staffing meet the target without creating unsustainable agent pressure?
Measure performance at the reason level, then compare it with internal baselines, customer feedback, and relevant external benchmarks. This approach helps leaders distinguish a genuine service problem from a queue that handles harder work.
Targets should change after major process, product, policy, or automation changes. A benchmark remains useful only while it reflects the promise customers receive and the resources teams can sustain.
Strategic Implementation and Continuous Improvement
Replacing a legacy dashboard requires more than adding AI metrics. Start by inventorying every current KPI, its data source, owner, formula, and management consequence. Retire measures that no longer influence decisions, then add outcome measures where automation or omnichannel service has made activity counts misleading.
Real-time monitoring belongs at the operational layer. Supervisors need queue conditions, staffing gaps, intent spikes, and service risk while they can still intervene. Weekly and monthly reviews should focus on trends, root causes, customer feedback, and whether previous actions changed the outcome.
Establish a feedback loop
Agents should participate in metric design and review. Their feedback can reveal broken knowledge, excessive authentication steps, misleading AI suggestions, and workflows that create unnecessary after-call work. Pair that qualitative evidence with interaction analysis, quality review, and segmented KPI trends.
An improvement cycle should follow a consistent pattern:
- Detect: Find a meaningful change in access, resolution, quality, workforce health, or outcome value.
- Diagnose: Segment by intent, channel, customer type, team, and time period.
- Act: Change staffing, routing, content, policy, coaching, or automation behavior.
- Validate: Check the primary KPI and its balancing measures.
- Standardize: Document what worked and make ownership permanent.
Leaders should watch for counterproductive behavior. ICMI reports that roughly a third of leaders say some metrics create mixed or counterproductive behavior, which is why every target needs a balancing measure and a clear customer outcome. A lower AHT isn't success if customers repeat the same request. Higher AI containment isn't success if customers escalate with greater frustration.
The best contact center metrics system behaves like an operating loop, not a reporting archive. It helps leaders see demand, understand friction, protect agents, improve automation, and make deliberate trade-offs before a local optimization becomes a customer problem.
Yellow.ai can help CX and operations teams track resolution time, CSAT, automation, containment, sentiment, conversation share, and human handoffs across AI-supported journeys. Visit Yellow.ai to evaluate how outcome-based analytics and agentic automation could fit your contact center strategy.