











You can have a dashboard full of green numbers and still feel like the team is missing the point. A contact center lead sees 94% SLA, the VP nods, and the queue still feels slow, uneven, and frustrating for customers. That mismatch is why the service level agreement formula matters more than the percentage on the slide, because the formula defines what counted, what got excluded, and what your organization promised to deliver.
The easiest way to think about it is a recipe. The ratio is the ingredient list, but the primary question is whether you measured the right ingredients in the first place. If your denominator is wrong, your SLA can look healthy while the customer experience is still broken, and that's where teams start looking for better routing, clearer exclusions, and smarter queue design. A useful place to see how operations teams think about this is Throughwire's private routing channel, where routing logic and service definitions are part of the same operational conversation.
Table of Contents
- Why the Service Level Agreement Formula Matters More Than the Number
- The Three Core Service Level Agreement Formulas Explained
- Worked Examples for Availability, Response, and Resolution
- Variations That Change the Math in Real Operations
- Excel Formulas, SQL Snippets, and Monitoring Setup
- Why One Global SLA Percentage Usually Lies
- SLA Formulas in the Age of CX Automation and Conversational AI
- Best Practices for SLA Measurement and Reporting
Why the Service Level Agreement Formula Matters More Than the Number
A support leader can look at a healthy dashboard and still miss a clogged queue. The gap usually appears when the SLA is treated like a score instead of a contract with clear measurement rules. In contact-center math, the standard formula is SLA = (Contacts Handled Within Target Time / Total Contacts) × 100, so the numerator and denominator do the work, not the percentage by itself. NICE's glossary uses that structure and shows the logic with a simple example, 850 of 1,000 calls answered within the threshold yields an 85% SLA. NICE service-level agreement glossary
A plain example helps. If a kitchen says it will serve meals within ten minutes, the promise is not “a high satisfaction score,” it is a timer-based commitment. The SLA formula works the same way. The team first defines which contacts count, then measures how many met the target window, then reports the result. If any one of those pieces is vague, the number can look clean while the operation is still under strain.
That distinction matters because people often collapse two different ideas into one phrase. An availability SLA measures whether a service stayed up, while a service-level SLA measures how quickly or effectively a team handled demand. The first belongs to infrastructure and uptime reporting, the second belongs to support operations, and the wrong mental model sends leaders into the wrong review meeting.
Practical rule: if the queue feels bad but the number looks fine, inspect the denominator first.
The denominator is where operational reality hides. If you tighten answer-speed targets, the measured SLA can fall even when staffing does not change, because more contacts now miss the stricter threshold. That is not a spreadsheet problem, it is a scope problem. Mature CX teams define what counts before they discuss performance, because the measurement window, the exclusions, and the channel rules all shape the outcome. Teams that manage multiple handoff points or routing rules often keep that reporting logic close to the systems that move work, including Throughwire's private routing channel, so the queue design and the service promise stay aligned.
The same percentage can describe very different stories. One team may be handling simple, low-friction work quickly, while another carries multilingual, high-complexity cases that belong in a separate service view. The formula tells leadership whether the promise was met, but only if the team agrees on which events were eligible to count in the first place.
The Three Core Service Level Agreement Formulas Explained
The cleanest way to learn SLA math is to sort the formulas by the business question they answer. One asks, “Was the system available?” Another asks, “Did we respond fast enough?” The third asks, “Did we finish the work inside the committed window?” Those are different promises, so they need different measurements.
A useful way to check this is to start with the operational setting, not the formula symbol. A paper mill motor program, for example, is judged on different failure patterns and service expectations than a software support queue, which is why industry-specific definitions matter. That is also why references such as solutions for paper mill motors can sit beside SLA guidance without confusing the metric itself. The service promise has to match the work being measured.
Availability, response, and resolution are not interchangeable
Availability formulas usually track uptime minutes against the full period after exclusions. That means the denominator is the period you meant to measure, not every minute on the calendar if planned maintenance is excluded. Azure's SLA guidance stresses that definitions and exclusions matter because availability can be measured per instance or across a pool, and excluded event types can materially change the result. Microsoft also notes that claims often require documented evidence and a separate submission process. Azure service-level agreement guidance
Response formulas are usually about how quickly the first meaningful action happened. In contact centers, the common pattern is a ratio of contacts handled within target time to total contacts, which is why service teams use it to measure speed. Resolution formulas are different again, because they care about whether the case was closed within the agreed window, not just whether someone answered it. Mojo Helpdesk describes the support-ticket pattern as SLA compliance % = (Tickets Resolved Within SLA / Total Tickets in Window) × 100, which makes it a good fit for enterprise queues that need one normalized control measure. Mojo Helpdesk on SLA compliance
A fast answer that doesn't solve the issue is a response win, not a resolution win.
Three Core SLA Formulas at a Glance
| Formula | Use Case | Numerator | Denominator | Typical Target |
|---|---|---|---|---|
| Availability SLA | Uptime and platform reliability | Uptime within the measured period | Total measured time after exclusions | Varies by service |
| Response SLA | First answer or acknowledgment | Contacts handled within target time | Total contacts in scope | Varies by queue |
| Resolution SLA | Ticket closure within committed window | Tickets resolved within SLA | Total tickets in window | Varies by priority |
The table works like a control panel. The labels tell you which dial you are reading, and the numerator and denominator show what the dial is counting. That is the point where many SLA conversations go wrong, because teams compare numbers before they agree on scope. A response SLA can look weak even when agents are busy if the queue rules moved more cases into a tighter time bucket. A resolution SLA can look strong while response is slipping, because the work is being closed later but still inside the end-to-end commitment.
That is also where operational reporting has to stay close to the systems that generate the events. If a team uses Zendesk and a connected automation layer, the measurement logic should reflect the exact status changes, routing rules, and business-hour settings that drive the queue, which is why a Zendesk integration for support workflows matters in the reporting design. The formula does not fix messy intake or inconsistent handoffs. It only measures them.
Keep the formula and the promise aligned. If the business promise is “first helpful answer,” response time is the right lens. If the promise is “problem solved,” resolution time is the right one. If the promise is “service stayed available,” uptime is the one to report.
Worked Examples for Availability, Response, and Resolution
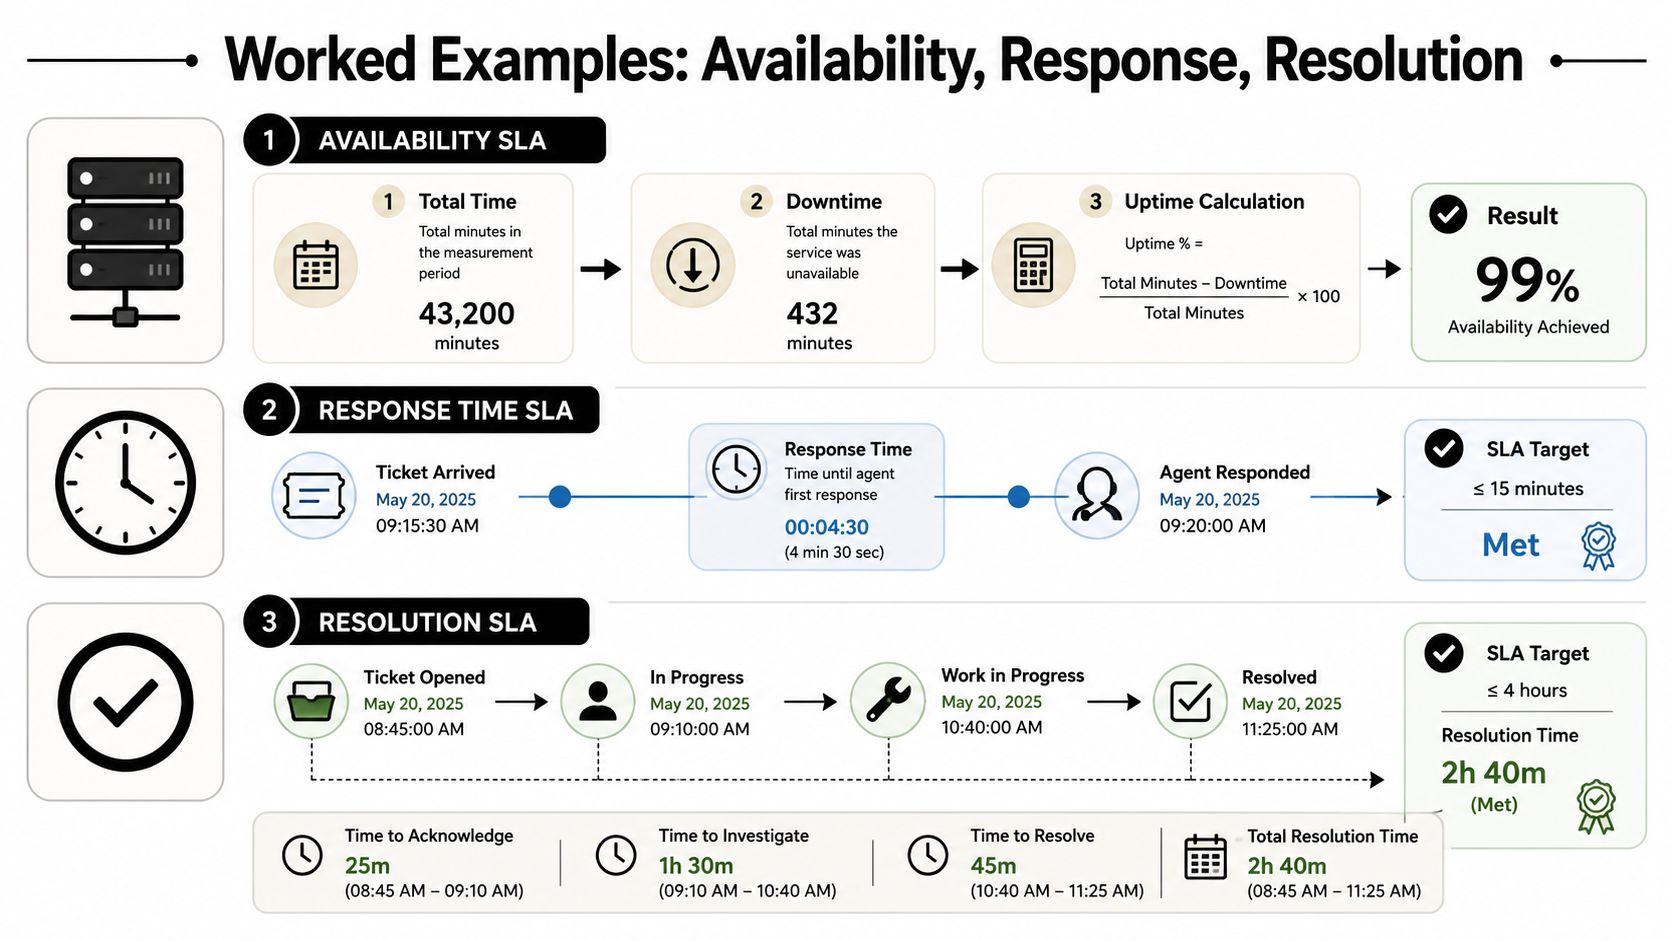
The fastest way to make SLA math click is to substitute real numbers slowly. That's how finance teams review a model, and it's how operations teams should review service reporting too. The arithmetic is simple, but the meaning changes depending on whether you're measuring uptime, first response, or completion.
Example 1 availability
For availability, start with the total minutes in the period, subtract planned maintenance if your policy excludes it, then compare the remaining uptime against the measured total. If the period has 43,200 total minutes and 432 minutes of downtime, the calculation shown in the visual is 43,200 minus 432, then divide the remaining uptime by 43,200, which produces 99% in that example. The point isn't the exact target, it's that exclusions change the denominator before the ratio is even calculated.
Example 2 first response
For a first-response SLA, the formula is straightforward. If 420 of 500 tickets were acknowledged within 1 business hour, the calculation is 420 / 500 × 100 = 84%. That number tells you how often the team met the acknowledgment promise, not whether the ticket was solved. If leadership wants faster customer reassurance, this is the metric to watch.
Example 3 resolution
For resolution, the logic is the same, but the outcome is full closure. If 1,150 of 1,400 tickets were closed within 24 hours, the calculation is 1,150 / 1,400 × 100, which is about 82.1%. The operational readout is different from response because a team can be quick to acknowledge and still slow to finish.
The internal move from one stage to another matters as much as the math. If you want to connect response and closure data to your current support stack, Yellow.ai's Zendesk integration is a useful reference point for how ticket flows can be connected across systems.
An elevator is a useful analogy. The SLA target is the floor you promised to reach, the formula tells you how often you achieved that level, and the gap between the two is the story your operations team owes leadership.
Variations That Change the Math in Real Operations
The textbook formula is rarely the whole story in enterprise support. Teams add rules because business reality is messy, and the math has to reflect that mess without becoming impossible to trust. Three variations show up often enough to matter: weighting, blackout windows, and rounding.
Weighted SLAs and composite scoring
A weighted SLA gives more importance to certain tickets, usually high-priority or high-value work. The base idea is still a ratio, but instead of counting every ticket equally, you multiply each ticket by its weight before you total the numerator and denominator. That is useful when a low-priority backlog would otherwise drown out urgent work, but it also makes the score harder to explain to non-operators.
Use weighting when leadership cares more about service quality on critical work than on raw queue volume.
The trade-off is clarity. A weighted score can show the right business signal, but it can also hide the operational truth that normal work is slipping while urgent work gets protected.
Blackout windows and maintenance exclusions
Blackout windows keep planned downtime from distorting the report. The base formula stays the same, but both the measured period and the eligible incidents shrink to exclude approved maintenance or other documented gaps. As noted earlier, excluded events and prerequisite failures can materially change the availability calculation, which is why the scope rules have to be written before reporting starts.
This approach is worth the extra policy work when scheduled changes would otherwise penalize the team for work everyone agreed to do. Consistency matters most here. If a blackout only appears after the fact, the metric starts to look like scorekeeping. Governance means the exclusion rule is defined, applied, and visible before anyone closes the month.
Rounding rules at the decision boundary
Rounding sounds minor until it changes a pass or fail call. Some teams round to the nearest whole number, while others floor the result for conservatism or ceiling it for reporting simplicity. The math is the same, but the operational decision can change at the boundary, so the rule needs to be written down before the month closes.
A simple reporting table can keep those choices visible.
| Variation | Base formula | Modification | Best use |
|---|---|---|---|
| Weighted SLA | Standard ratio | Multiply priority by weight | Critical queues |
| Blackout window | Standard ratio | Remove approved downtime | Planned maintenance |
| Rounding rule | Standard ratio | Define rounding policy | Executive reporting |
If the rule only appears during dispute resolution, it is already too late. Put the policy in the metric definition, not in the meeting notes.
For teams validating how ticket states move across channels, Yellow.ai's automated testing resources can help confirm that the measurement flow matches the definition before the report goes live.
Excel Formulas, SQL Snippets, and Monitoring Setup
A good SLA definition fails fast when the workbook can't reproduce it. That's why the implementation layer matters as much as the formula itself. If analysts can't calculate the same result in Excel and SQL, the metric will drift the first time someone filters the data differently.
For a basic ticket compliance metric in Excel, one workable pattern is:
=COUNTIFS(ClosedDateRange,">="&StartDate,ClosedDateRange,"<"&EndDate,ResolutionTimeRange,"<="&SLAThreshold)/COUNTIFS(ClosedDateRange,">="&StartDate,ClosedDateRange,"<"&EndDate)
That formula counts tickets closed inside the reporting window and divides the tickets that met the threshold by the full set in scope. The structure mirrors the support-ticket compliance formula described earlier, which keeps the workbook aligned with the definition instead of inventing its own logic. If you're testing or validating the flow around ticket movement, Yellow.ai's automated testing resources are a practical place to think about repeatability across channels and changes.
For SQL, a simple version looks like this:
SUM(CASE WHEN resolution_time <= sla_threshold THEN 1 ELSE 0 END) * 1.0 / COUNT(*)
That pattern is easy to extend. Add a WHERE clause for business hours, a priority filter for segmented reporting, or a join to a calendar table if you need exclusions for blackout periods. If you need weighted scoring, replace the 1 in the CASE statement with the ticket weight so high-priority items contribute more to the numerator and denominator.
Audit rule: the query should explain itself without a separate slide deck.
Monitoring cadence should follow the decision the metric supports. Real-time recomputation is useful for alerts, hourly refresh works for operational dashboards, and monthly review is better for governance because it gives teams time to validate edge cases. Sample the underlying tickets before executive reporting so someone can trace the calculation back to source records and spot bad timestamps, incorrect closures, or exclusion logic that slipped.
The final check is simple. Compare the workbook, the query, and the vendor dashboard against the same time window, same exclusions, and same ticket set. If the numbers differ, the first place to look is usually the filter logic, not the arithmetic.
Why One Global SLA Percentage Usually Lies
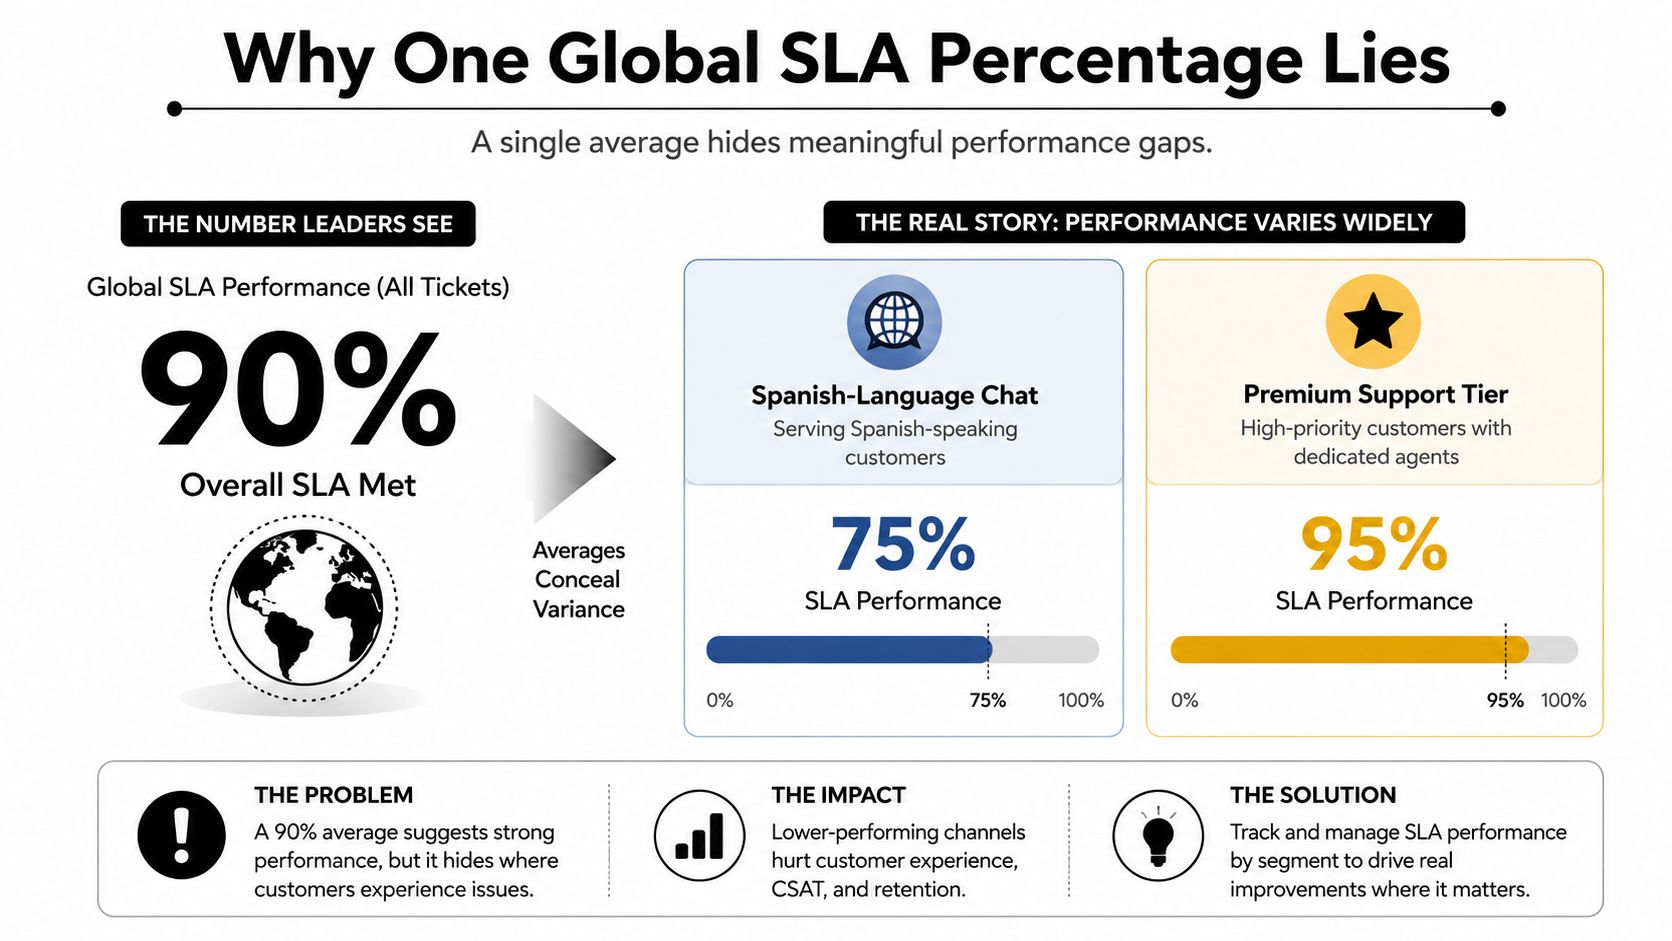
A single enterprise SLA can be tidy and misleading at the same time. It gives executives one number to track, but it can hide uneven service across channels, languages, and priorities. A team can report a healthy global average while Spanish-language chat lags, premium support stays strong, and low-priority email drags the combined result into a story nobody can act on.
Segmentation makes the metric honest
The same formula can and should be applied to filtered subsets. That means one calculation for voice, another for chat, another for email, and separate views for premium tiers, language groups, regions, or product lines. Call Centre Helper notes that the basic formula may be adjusted across voice, email, social, and web chat, including cases where abandoned contacts are counted differently, while Mojo Helpdesk recommends aligning SLA policies with business hours and separate priority levels. Call Centre Helper on service level calculation
When leaders need a combined enterprise view, the weighted roll-up should come after the segmented views, not instead of them. That order matters because it keeps the detailed performance visible long enough for managers to intervene on the queues that need help.
| Segment | Same formula applied to | Why it matters |
|---|---|---|
| Channel | Voice, chat, email, social | Different customer expectations |
| Priority | VIP, standard, low priority | Urgency changes the service promise |
| Language or region | Spanish, English, local market | Staffing and routing differ |
| Product line | Billing, technical support, onboarding | Workload and complexity vary |
A global average is only useful when the audience needs one summary number. For day-to-day management, the segmented view is the one people trust because it shows where performance is strong, where it is weak, and where the queue design needs attention.
SLA Formulas in the Age of CX Automation and Conversational AI
Automation changes the shape of the queue, but it doesn't make SLA math irrelevant. It changes which part of the queue deserves attention. If a conversational AI deflects simpler requests, the denominator shrinks and the remaining tickets may be more complex, so the same SLA formula now describes a tougher population than before.
That's why containment and deflection matter as leading indicators. They help explain whether the SLA is rising because the bot handled more traffic or falling because only harder cases reached the agents. Escalation latency also becomes part of the response-time story, because handoffs from bot to human can add delay even when the first-touch experience feels instant.
The SLA formula doesn't disappear in an automated model, it becomes more sensitive to where work enters the queue.
Platform dashboards make that visible in real time. An agentic CX stack can surface live SLA performance, routing state, and escalation behavior together, which is useful when staffing, bot design, and queue policy all influence the same outcome. One option in that category is Yellow.ai's agent assist capabilities, which fit naturally into the broader workflow of live support operations.

Best Practices for SLA Measurement and Reporting
A trustworthy SLA program is mostly discipline. The math is easy compared with the governance around it, which is why the teams that win usually write the rules down and keep them stable.
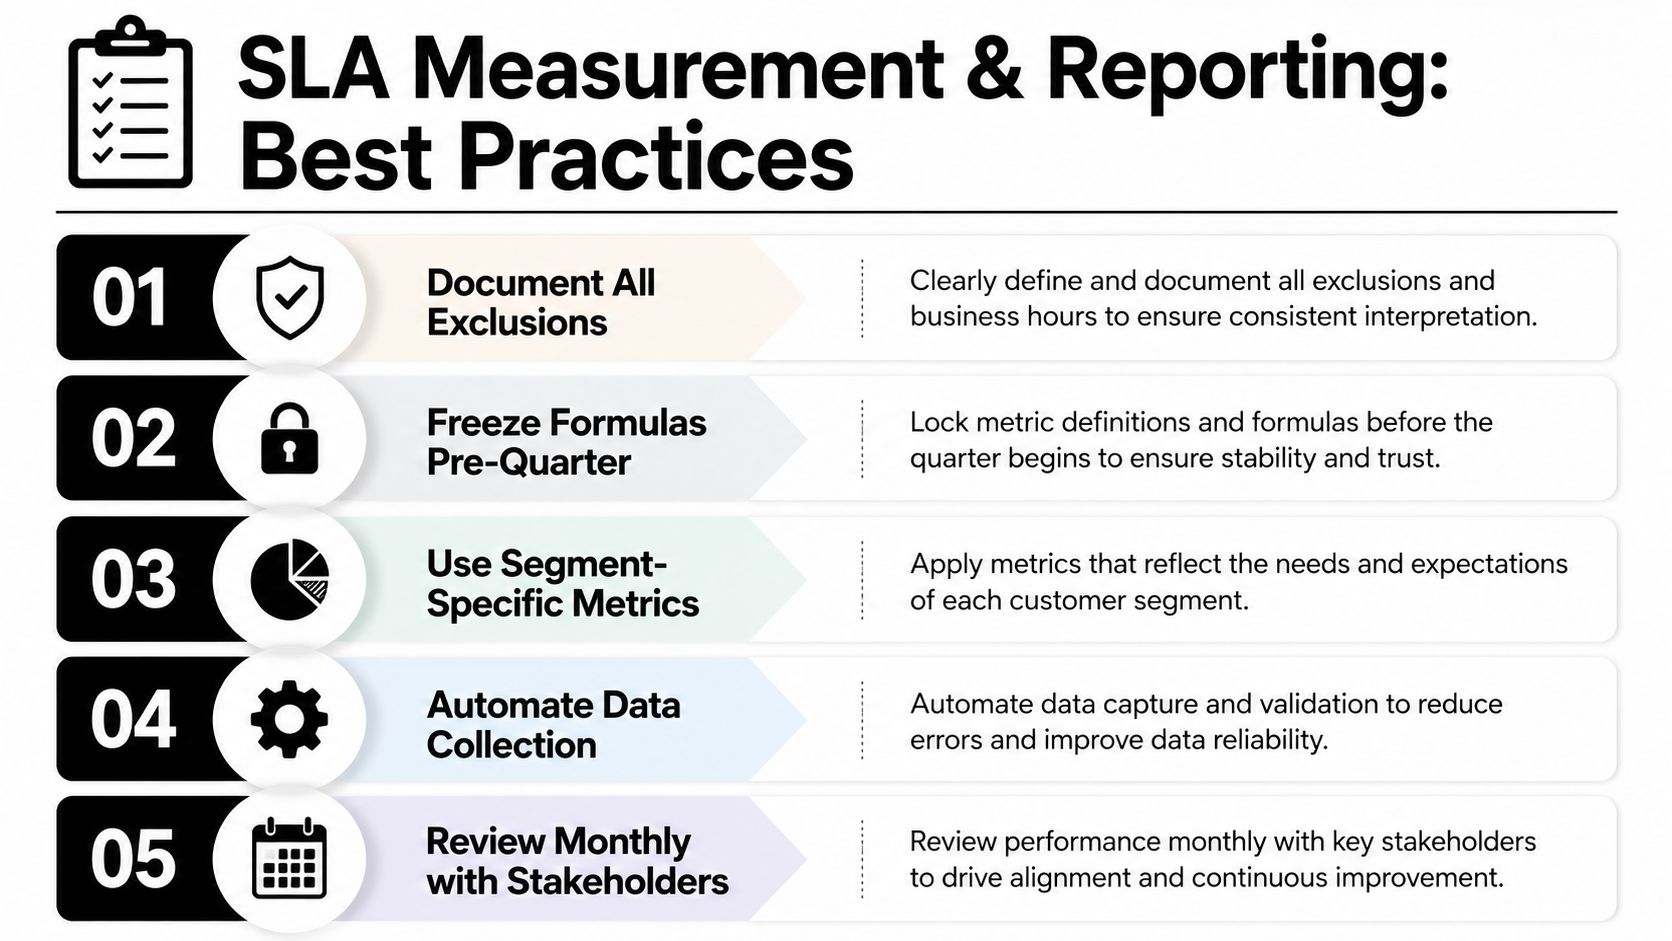
- Document all exclusions. Write down planned maintenance, excluded ticket types, and any event definitions before the month starts.
- Freeze formulas pre-quarter. Keep the calculation stable so historical comparisons still mean something.
- Use segment-specific metrics. Keep channel, priority, and language views separate before creating an executive roll-up.
- Automate data collection. Pull from source systems instead of hand-building numbers in slides.
- Review monthly with stakeholders. Publish the formula alongside the number so reviewers know exactly what changed.
Daily reporting works for operators, weekly reporting works for service owners, and monthly reporting works for executives. That cadence keeps the metric useful without turning every small fluctuation into a governance debate.
Trust comes from transparency. The formula is the contract, the denominator is the scope, and SLA reporting only drives decisions when everyone in the room believes the number enough to act on it.
A CTA for Yellow.ai.