









The demo went well. Your support assistant answered a dozen questions in front of the steering committee, scored 92% on the internal accuracy check, and the pilot got funded. Six weeks into production, a customer asks about a refund after 45 days and receives a confident reply quoting the 30-day window, because the retriever pulled the standard policy page and never surfaced the marketplace exception buried two documents deeper.
None of that shows up as a number anyone can act on. Accuracy slides from 92% to 89%, and the room splits into two camps: the engineers who blame the model and the content team who blame the search index. Nobody can say whether the retriever fetched the wrong page or the generator misread the right one.
That's the problem rag evaluation metrics solve when you use them properly. Not as a leaderboard score, but as a diagnostic chain where each low value points at one component and one fix. What follows gives you the metric set with realistic ranges, the score patterns that identify which stage broke, and the operational measures (latency, cost, escalation accuracy) that most evaluation write-ups leave out. By the end, you should be able to separate a search failure from a synthesis failure in about a minute of reading a dashboard.
Table of Contents
- Why One Accuracy Score Hides RAG Failures
- The Core RAG Metrics at a Glance
- Retrieval Metrics That Show Whether Evidence Arrived
- Generation Metrics That Show Whether Answers Hold Up
- Diagnosing Failures by Reading Metrics Together
- Operational Metrics Most Scorecards Leave Out
- Build and Confirm Your RAG Scorecard Before Launch
Why One Accuracy Score Hides RAG Failures
RAG has two stages, and they fail in ways that look identical from the outside. A retriever searches your knowledge base and returns passages. A generator reads those passages and writes the reply. When a refund window comes back wrong, either the retriever never found the exception clause, or it found it and the generator ignored it while sounding completely certain.
A single end-to-end accuracy figure collapses both stages into one decimal. It tells you something is broken. It can't tell you where, and that's the difference between an afternoon of chunking changes and three weeks of prompt tinkering that fixes nothing.
This is why evaluation moved past exact-match scoring. The ARES evaluation framework, tested on 150 annotated data points from each mock RAG system, reported Kendall's tau correlations 0.132 higher for answer relevance than Ragas across the evaluated datasets, and beat sampled human annotations by an average of 0.08 Kendall's tau while using 78% fewer annotations. Benchmarks like RAGBench, with 100,000 examples and the TRACe rubric covering utilization, relevance, adherence and completeness, pushed the field toward grading the parts of an answer instead of stamping it pass or fail.
So the working method is to score the retriever and the generator separately, then read those scores as a chain. Each low value implicates a specific piece of the pipeline.
You leave this guide with four things: a shared vocabulary the content team and the ML team can both use, the range and meaning of each score, a lookup table from score pattern to component to fix, and a launch scorecard that includes latency and cost next to faithfulness. The history of the frameworks matters less than acting on the numbers.
The Core RAG Metrics at a Glance
Eight metrics cover most of what an enterprise deployment needs, split cleanly between the two stages. The Ragas framework, introduced in a 2023 research paper, formalized the first three (faithfulness, answer relevance and context relevance); later implementations added context precision, context recall and answer correctness, which is where most production scorecards now start.
| Metric | What It Measures | Typical Range | A Low Score Usually Means |
|---|---|---|---|
| Context precision | Share of retrieved chunks that are useful, weighted toward higher ranks | 0 to 1, higher is better | Noise: irrelevant chunks crowd out useful ones |
| Context recall | Share of the information needed for the reference answer that was retrieved | 0 to 1, higher is better | Missing knowledge: relevant text never reached the generator |
| Context relevance | Whether retrieved passages stay focused on the user's query | 0 to 1, higher is better | Off-topic or padded passages in the context window |
| Faithfulness | Supported claims divided by total claims in the answer | 0 to 1, higher is better | Hallucination or unsupported extrapolation |
| Answer relevance | Whether the response addresses the question actually asked | 0 to 1, higher is better | Evasive, generic or off-question answers |
| Answer correctness | Agreement between the answer and a reference answer | 0 to 1 in most tools, higher is better | Wrong facts, even when the answer sounds grounded |
| Answer completeness | Coverage of required conditions, exceptions, deadlines and next steps | 0 to 1, higher is better | Technically grounded answers that omit key limits |
| Context utilization | Whether the answer actually relies on the retrieved evidence | 0 to 1, higher is better | The model ignores good retrieval and answers from its own memory |
Read the numbers as signals, not grades. A 0.72 faithfulness score isn't "a C"; it's a flag that roughly one claim in four lacked support in the retrieved text, and your job is to find out which claims and why.
The comparability trap catches almost everyone. A score is only meaningful against the same judge model, the same prompt template and the same evaluation set. Swap the judge from one model family to another and a 0.7 can drift by several points without a single change to your pipeline.
Working rule: pin the judge model, the rubric and the dataset version in your repository, and treat any change to them as a new baseline rather than a regression.
Retrieval Metrics That Show Whether Evidence Arrived
Think of the retriever as a librarian and the generator as the writer who works from the books she brings back. Three metrics judge the librarian's work, and each maps to a different mistake she can make.
The librarian framing is worth keeping because retrieval failures are so often described as "the AI was wrong" when nobody ever handed it the right page.

Context precision asks how many of the fetched books are useful. Say a query returns five chunks and two of them contain the answer. Precision lands around 0.4, and the generator now spends its attention budget sifting three distractors. Because precision is rank-weighted, the same useful chunk at position five counts for less than at position one, which is why a reranker often moves this score more than a bigger context window does.
Context recall asks whether every needed book came back. A refund answer depends on three conditions: the purchase channel, the elapsed days and the product category. If the retriever returns only two of the three, recall sits near 0.67 even while precision looks healthy. This is the metric that exposes a corpus gap, and no amount of prompt engineering recovers text that never entered the context window.
Recall is the expensive one to measure, because it needs reference answers or labeled evidence passages. Start with 30 to 50 high-risk questions per intent rather than the full corpus. Payments, benefits and eligibility questions earn a place in that set long before generic FAQ traffic does.
Context relevance judges whether the passages stayed on topic. A chunk that discusses refunds generally, when the question is about refunds for damaged goods, drags this score down and pads the prompt with text the model has to filter out. How you structure and chunk the source material drives both precision and relevance, which is why building a knowledge base that retrieval can actually use deserves as much review time as prompt writing.
Check retrieval scores before generation scores. A generator cannot be faithful to evidence it never received, and blaming the model for a retrieval gap is the most common misdiagnosis in RAG debugging.
Generation Metrics That Show Whether Answers Hold Up
The trap that catches experienced teams: a passage can be perfectly relevant and the answer built from it can still be unfaithful. Relevance grades the passage. Faithfulness grades the answer. They are different tests, run against different objects, and a system can pass the first while failing the second through unsupported extrapolation, dropped conditions or a confidently rounded number.
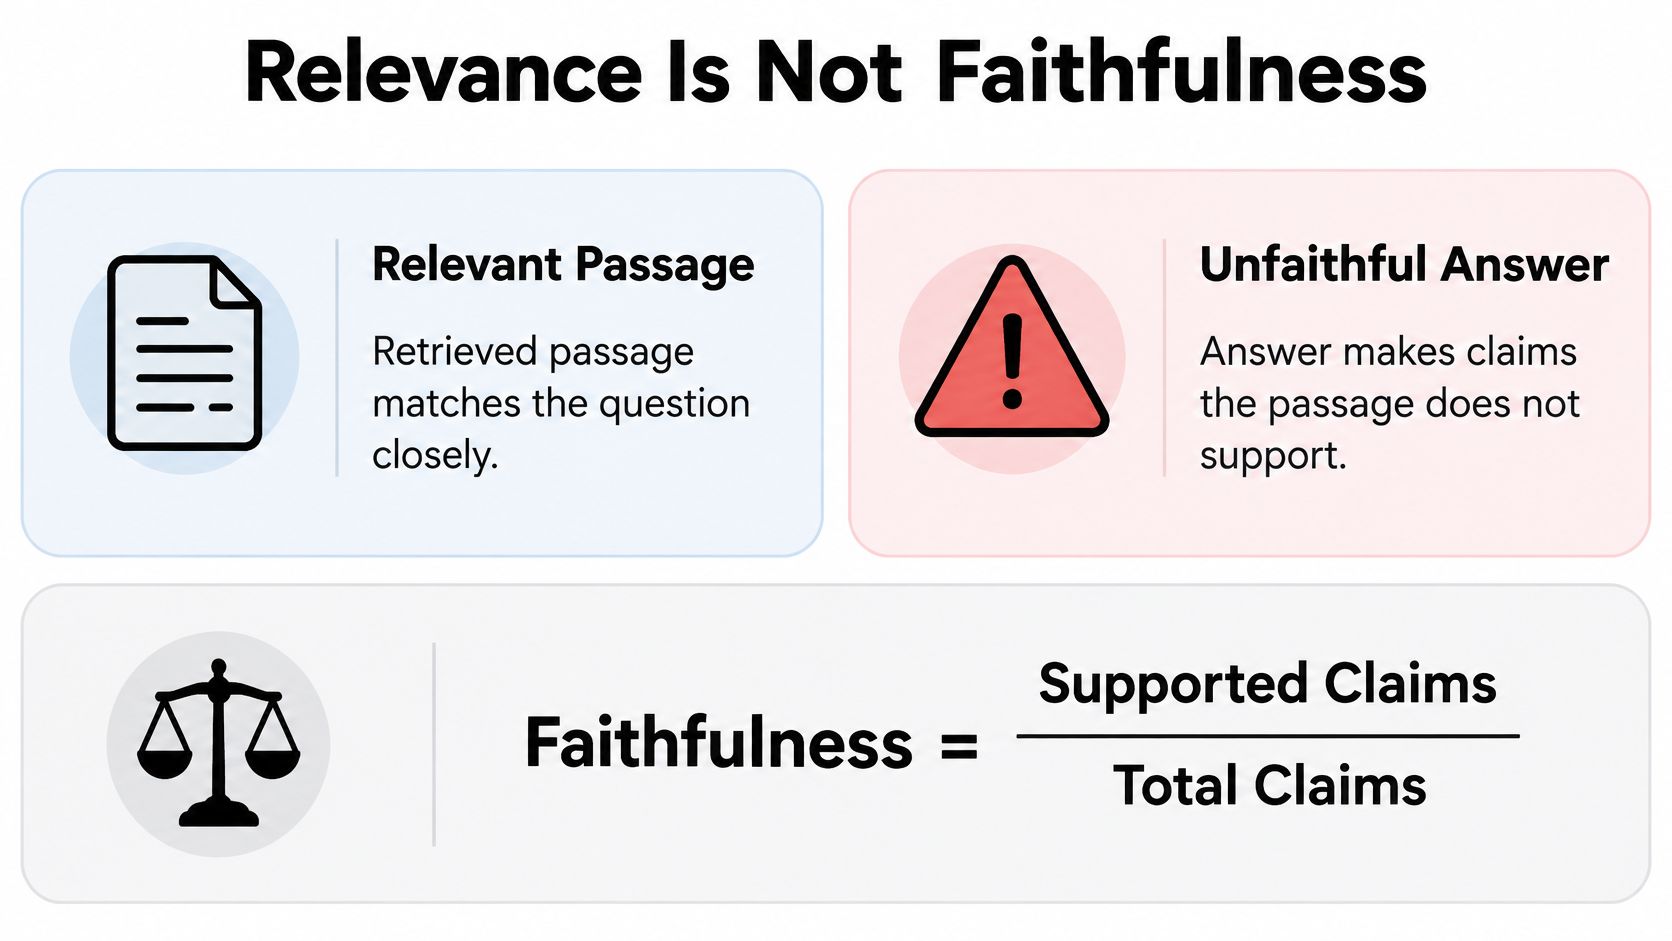
Faithfulness and relevance answer different questions
An answer that makes five claims, four of them traceable to the retrieved passage, scores 0.8. The fifth claim is the hallucination to chase, and it's usually the one that sounds most helpful: a specific date, a dollar figure, a policy exception the model inferred rather than read.
Answer relevance catches a different failure. The answer is grounded, well written and completely addresses a question the user didn't ask, because intent classification routed "cancel my subscription" into the billing-refund path. Everything in the pipeline worked; the front door was wrong.
Answer correctness compares the response against a reference answer. It's only as good as that reference, so keep the reference set owned by the people who know the policy, not by whoever wrote the prompts.
The metrics that catch omissions
Answer completeness is the one most scorecards forget, and it's the one that hurts in regulated support. A grounded answer that states the refund eligibility but omits the 14-day deadline and the exclusions is technically faithful and operationally useless. The RAGBench evaluation work extends conventional scoring with context utilization, which detects whether the model relied on the retrieved evidence, and answer completeness, which surfaces answers that are grounded but partial.
Context utilization matters when the model has good retrieval and ignores it, defaulting to its pretraining memory. That pattern looks like high faithfulness on easy questions and sudden drift on anything that changed recently.
If grounding failures are the pattern you keep seeing, the practical countermeasures in this guide to preventing AI hallucinations in customer-facing agents pair well with the scoring approach here.
Report these scores per intent and per error type, never as one mean. A global faithfulness of 0.91 can hide a benefits intent sitting at 0.62, and the mean will keep everyone comfortable until an audit finds it.
Diagnosing Failures by Reading Metrics Together
Single scores are nearly useless in isolation. Patterns locate the fault. Read the retrieval trio first, then the generation trio, and the combination tells you which component to open.
| Score Pattern | Likely Cause | First Fix |
|---|---|---|
| Low context precision, acceptable context recall | Noisy chunks and too many results per query | Tune chunk size, add metadata filters, add a reranker, or lower top-k |
| Low context recall | Relevant passages never retrieved | Add query expansion, hybrid keyword and vector search, or check corpus coverage |
| High retrieval scores, low faithfulness | Generator adds unsupported claims during synthesis | Tighten the grounding prompt, require citations to passages, and reduce creative sampling |
| High faithfulness, low answer relevance | Grounded answer to a neighboring question | Revise the prompt to answer the question asked and check intent classification |
| High faithfulness, low answer completeness | Eligibility limits, exceptions or deadlines dropped | Add instructions to include conditions and exceptions, and test those intents separately |
| Good retrieval, low context utilization | Model ignores the evidence and answers from memory | Restructure the prompt so evidence precedes the question, and test with shorter contexts |
The cause-effect separation is what makes this workable at scale. As the analysis of retrieval and generation scoring puts it, low context precision points to chunking, metadata filters, reranking or top-k selection, while low context recall points to query expansion, hybrid retrieval or corpus coverage. High retrieval scores with low faithfulness point at synthesis or prompt control instead. Different components, different owners, different fixes.
Slice every one of those metrics by intent, language, channel and escalation severity. An aggregate average conceals failures in exactly the workflows where a wrong answer costs money or triggers a compliance review.
Change one component at a time, re-run the identical question set, and compare. Two simultaneous fixes produce a score movement nobody can attribute.
That discipline is unglamorous and it's the fastest route to a system you can defend in an audit.
Operational Metrics Most Scorecards Leave Out
Here's the uncomfortable part of the evidence. A system can post excellent faithfulness scores and still fail in production, and most of the published evaluation guidance gives you no tool for spotting that in advance. A recent review of RAG evaluation practice reports that only 47.3% of RAG studies evaluate efficiency, and safety receives attention in just 9.1% of studies. The metrics that decide whether a deployment survives contact with real traffic are largely absent from the literature.
Add these to the scorecard, each paired with the business question it answers.
- p95 latency: does the answer arrive fast enough to be useful? On voice channels a correct answer delivered three seconds late still produces a hang-up, and the average hides the tail that callers experience.
- Cost per resolved interaction: what does retrieval plus generation cost for one conversation that ends without a human? Token counts per turn, reranker calls and retries all land here.
- Escalation rate and escalation accuracy: is the system handing off the right cases? A low escalation rate looks efficient until the transcripts show frustrated customers trapped in a loop.
- Containment and resolution rate: did the interaction end without a transfer, and did it end with the customer's problem solved? Those are different numbers and only one of them belongs in a board deck.
- Handle-time reduction: for agent-assisted flows, how much time does the assistant give back to the human?
- Abstention quality: when the evidence is missing, does the system decline cleanly instead of improvising? A confident wrong answer is worse than an honest handoff.
Segment each measure by channel, language, intent and risk tier. A voice escalation rate of 18% overall can hide 40% on one language, and that's the number that generates complaints.
The contrarian conclusion follows from the evidence rather than from sentiment: the highest-scoring system on faithfulness is not automatically the best business system if it's slower, costlier or worse at closing real interactions. Quality scores tell you the answer is defensible. Operational scores tell you the deployment is viable. You need both columns.
Build and Confirm Your RAG Scorecard Before Launch
Seven steps take you from a vague sense that the assistant is "pretty good" to a scorecard you can sign off on.
- Collect real questions from logs or pilot traffic. Cover every intent, language and channel in scope, because a test set drawn from chat alone will miss the phrasing voice callers use.
- Write expert-labeled reference answers and mark the evidence passages behind each one. Without labeled evidence, retrieval can't be scored separately from generation, and every failure stays ambiguous.
- Score the two stages apart. Context precision, context recall and context relevance on one side; faithfulness, answer relevance, answer completeness and context utilization on the other. One low value, one component.
- Add the operational measures. p95 latency, cost per resolved interaction, escalation accuracy and resolution rate, each segmented by channel and risk tier, so a quality win that costs twice as much is visible as a trade rather than a triumph.
- Set thresholds per risk tier. Payments, benefits and regulated workflows need stricter floors than general FAQs, because the cost of a wrong answer isn't symmetrical across intents.
- Re-run the same set after every change to prompts, chunking, models or knowledge base updates, so a score movement belongs to the change that caused it.
- Read a sample of failures by hand. Automated judges misgrade, and twenty minutes with ten failing transcripts will teach you more than a week of dashboard staring.
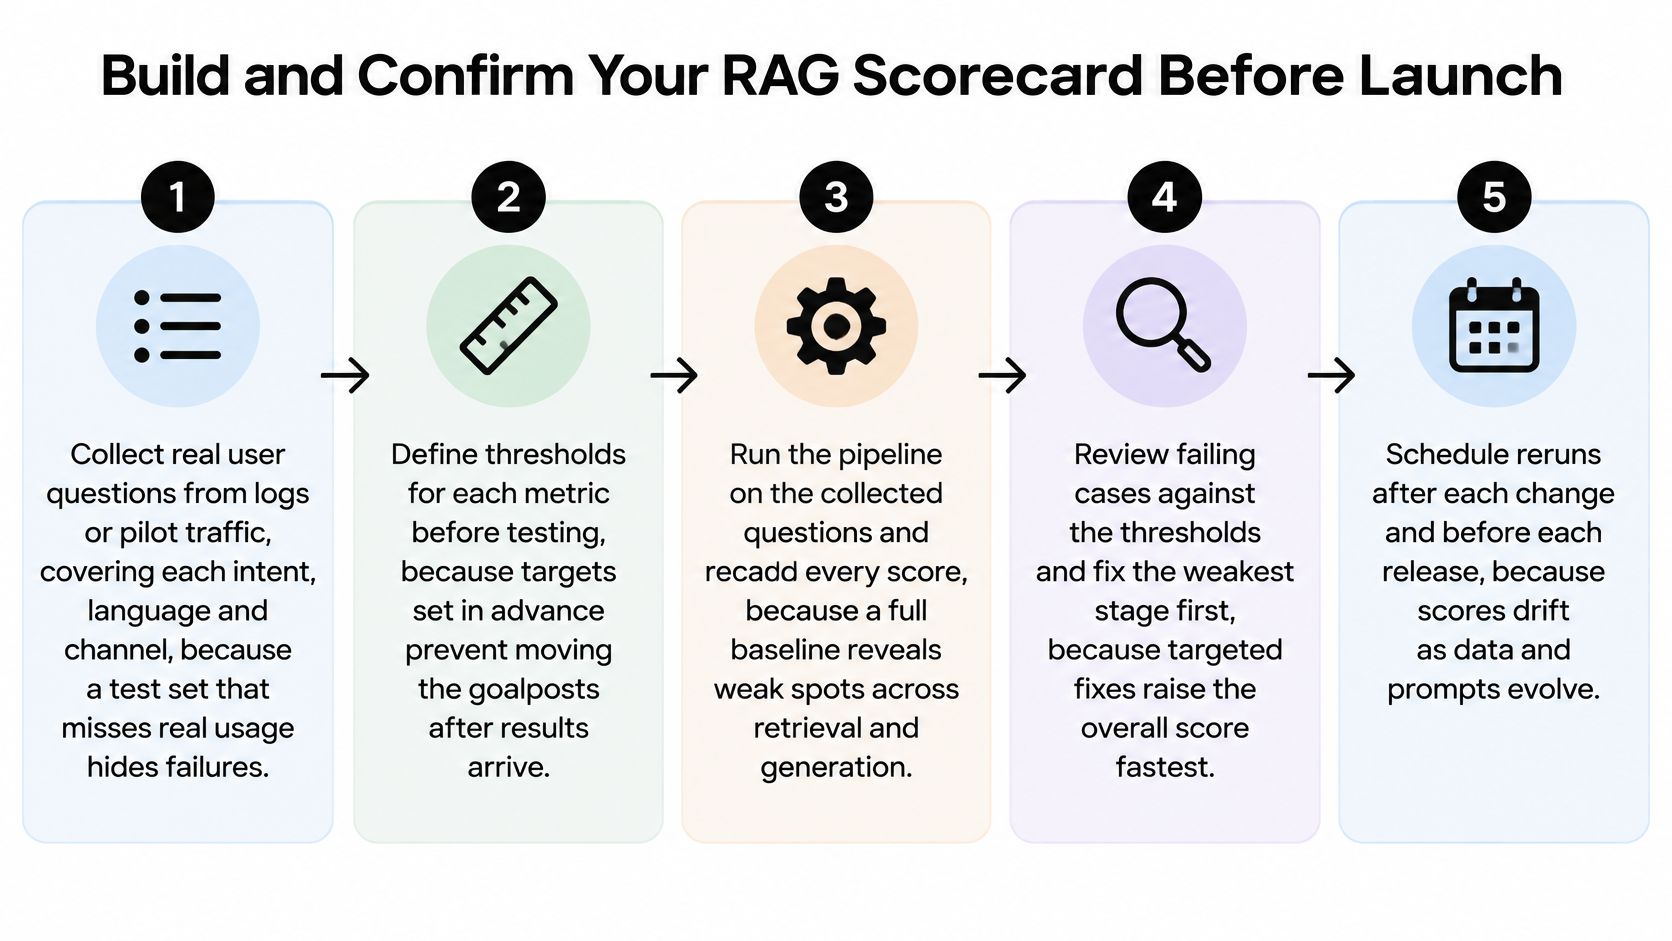
Then hold the line: launch only when every risk tier clears its thresholds. A weighted average that lets strong FAQ performance carry weak payments performance is how a launch review approves something nobody would defend in a post-incident meeting.
Keep the scorecard under version control with the dataset and judge configuration it was computed against. When someone asks six months from now whether quality has drifted, the answer should be a diff, not a debate.
Running the same set through automated conversational AI testing before each release keeps the scorecard from becoming a one-time artifact. Our platform pairs that with analytics reporting 20+ real-time actionable insights, including deflection rate, goal completion rate, CSAT and first response time, so the quality scores and the operational scores sit in the same view.
Start by pulling fifty real questions from your logs and labeling the evidence behind each answer. That single afternoon of work will tell you more about your assistant than any vendor benchmark, because it scores your corpus, your chunking and your prompts against the traffic you serve. When you're ready to run that scorecard continuously, with automated testing before each release and live analytics for latency, escalation and resolution, Yellow.ai gives you one place to build, test and monitor the agents your customers and employees depend on.