











Your board deck is finished, the revenue line looks strong, and then someone asks why the cash forecast doesn't match the reported top line. That's the moment the difference between gross sales and revenue stops being academic. If gross sales got labeled as revenue, the model can overstate what the business earned, distort margin thinking, and push finance, CX, and operations into the wrong conversations.
| Metric | What it captures | Typical use | Common pitfall |
|---|---|---|---|
| Gross Sales | Total sales transactions before deductions | Demand, pipeline throughput, sales execution | Mistaken for realized income |
| Net Sales | Gross sales after returns, discounts, and allowances | Operational performance and customer adjustment tracking | Treated as if it includes other income |
| Revenue | Broader top-line income, including non-core inflows in some cases | Financial reporting, forecasting, board review | Confused with transaction volume |
Table of Contents
- Introduction to Gross Sales vs Revenue
- Understanding Gross Sales and Revenue
- Calculating Gross Sales and Revenue
- Income Statement Treatment Comparison
- Use Cases and SaaS Nuances
- Reporting and KPI Implications
- Best Practices for Finance and Operations Leaders
Introduction to Gross Sales vs Revenue
A finance leader rolls into the quarterly review with a clean slide and a hard number, only to hear the CFO ask why the margin bridge doesn't tie. The answer usually sits in plain sight. Gross sales were presented as if they were revenue, but deductions, recognition timing, and other income were never separated cleanly enough to support the forecast.
That mix-up changes more than a definition. It can lead teams to overestimate demand quality, set pricing around the wrong base, and brief the board with a top line that isn't comparable across periods or business models. In companies selling subscriptions, usage-based services, or multi-year contracts, the risk is even higher because booked activity and recognized income rarely move in lockstep.
The practical fix is simple in concept, harder in execution. Keep gross sales as the transaction-level demand signal, keep revenue as the accounting outcome, and never let the two stand in for each other without normalization. That discipline is what makes board decks, operating reviews, and forecast models tell the same story.
Understanding Gross Sales and Revenue
What gross sales actually means
Gross sales is the starting figure, the total amount from selling goods or services before any deductions. In everyday business conversation, people sometimes use sales and revenue interchangeably, but accounting guidance separates them clearly, and that separation matters once returns, discounts, or allowances start to move materially. A company can post impressive gross sales and still end up with materially lower net sales after deductions, which is why the gross number alone can be misleading (PNC explains the distinction between revenue and sales).
Gross sales is also the cleaner signal for go-to-market activity. It tells you what was sold before the accounting adjustments, which makes it more useful for understanding demand, channel behavior, and customer response to pricing or promotions. It does not, by itself, tell you what the business ultimately realized.
What revenue includes
Revenue is broader. It includes the income statement top line and can include non-operating inflows such as interest, royalties, rent, and gains from asset sales, which is why revenue is usually a KPI with a wider scope for finance teams (Salesforce on revenue versus sales). That broader scope is exactly why revenue is the number that belongs in external reporting and board-level reviews.
Practical rule: use gross sales to understand demand, and use revenue to understand the business's reported financial outcome.
The relationship between the two is directional, not identical. Sales is a subset of revenue, while revenue is the larger umbrella. Once you keep that hierarchy straight, you can stop asking whether the numbers “match” and start asking whether they're meant to answer the same question.
Calculating Gross Sales and Revenue
Start with the transaction-level view
The cleanest way to calculate gross sales is to start with billed transactions before deductions. In operational terms, that can be estimated as price × units sold, or as the sum of all transactions captured before returns, discounts, and allowances are applied (DataStudios on revenue versus sales differences). That makes gross sales a throughput metric, not a final financial outcome.
A simple workflow helps:
- Capture all sales at the source. Use order, invoice, or booking data as the base.
- Separate deductions. Keep returns, discounts, and allowances out of the gross figure.
- Reconcile to a net figure. Subtract those deductions to get net sales.
- Check any other income streams. Only then can you understand reported revenue.
A sample structure looks like this:
| Component | Gross Sales | Adjustments | Revenue |
|---|---|---|---|
| Product or service transactions | Included | None at this stage | Included in core sales |
| Returns | Not deducted yet | Deducted | Reflected after normalization |
| Discounts | Not deducted yet | Deducted | Reflected after normalization |
| Allowances | Not deducted yet | Deducted | Reflected after normalization |
| Other income such as interest or royalties | Not included | Added separately if applicable | Included where relevant |
Where teams go wrong
The most common error is mixing deduction logic with top-line logic. If the ERP or BI layer pushes discounts into revenue before finance has a chance to review the transaction detail, leaders lose the ability to trace what drove the change. Another common error is treating non-core income like it came from sales activity, which inflates go-to-market conclusions.
Revenue is the accounting outcome metric, while gross sales is the pipeline-throughput metric. That distinction matters because gross sales can overstate realized value when returns, discounts, taxes, or unsettled receivables are material, while revenue is the more stable figure for planning and board reporting (DataStudios).
Income Statement Treatment Comparison
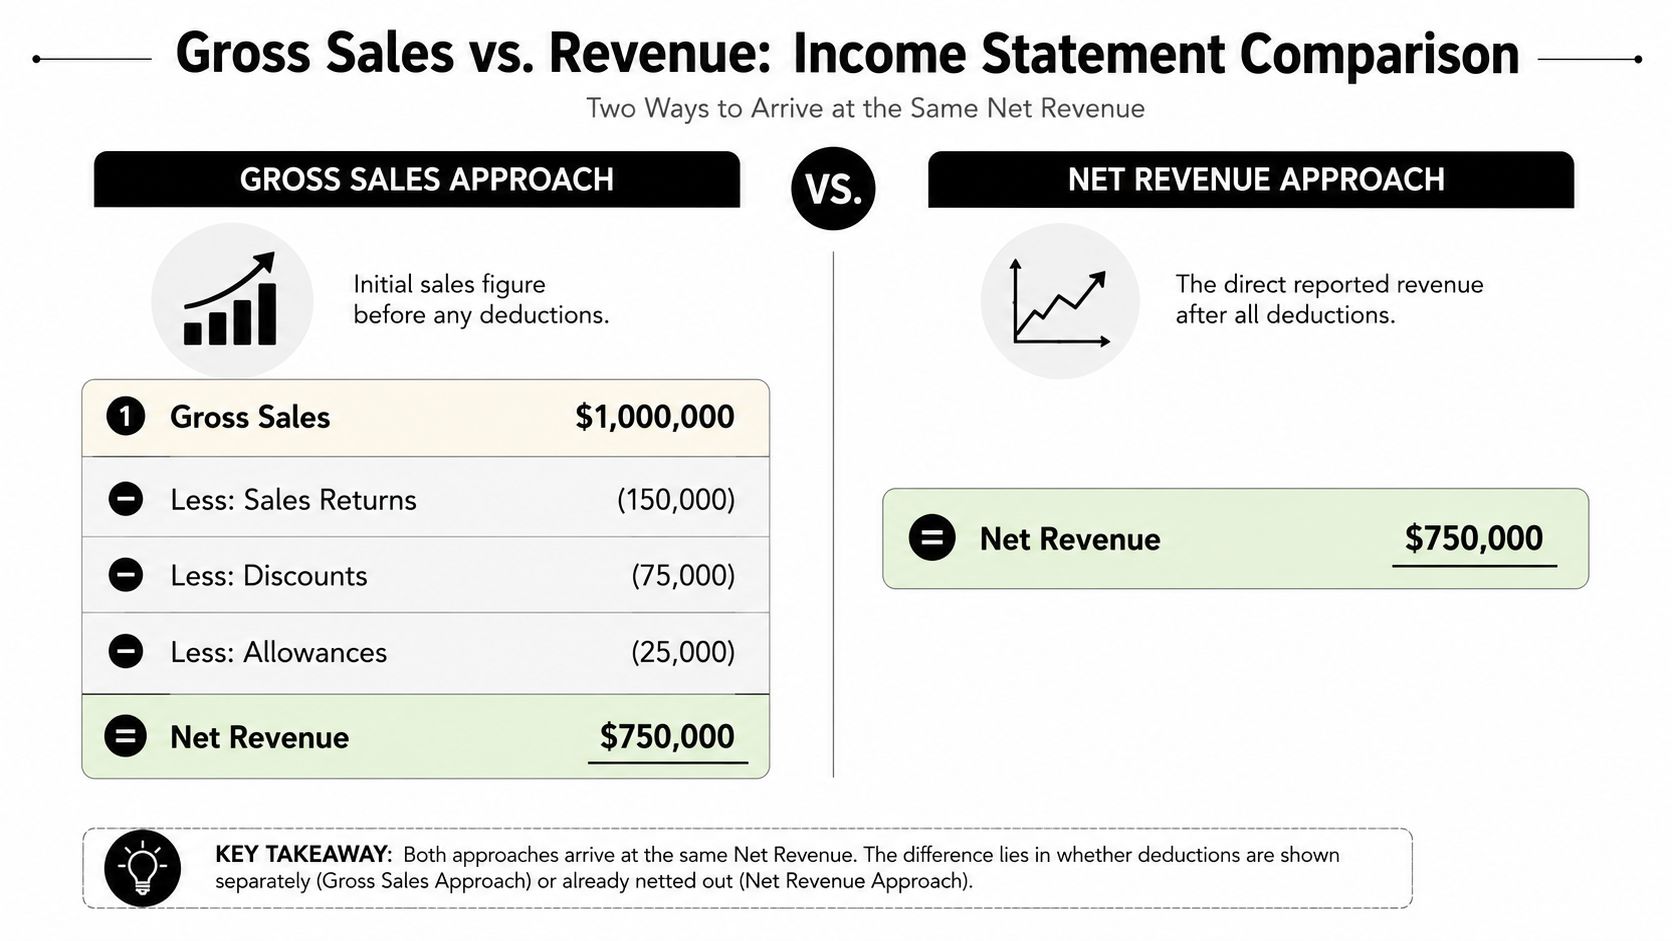
The same business activity can look very different depending on how the income statement is structured. A gross sales approach starts high, then shows deductions as separate lines. A net revenue approach begins with the final, reported figure. Finance teams need both views, but they need them for different reasons.
Gross sales presentation
A gross sales-led P&L often shows a large opening sales figure, then subtracts returns, discounts, and allowances before arriving at net sales. That layout is useful when CX teams need to see whether product quality, fulfillment issues, or promotional behavior is eroding realized value. It makes the deduction trail visible, which helps operations teams understand what's happening after the sale.
Net revenue presentation
A net revenue presentation is more compact. It strips away the transaction clutter and shows the amount that belongs in financial reporting after the relevant adjustments are made. That's the right view for the income statement because it keeps the board focused on the reported outcome, not the selling activity.
The key is not choosing one and abandoning the other. The best finance teams keep gross sales visible internally, then roll it into a normalized revenue view that can stand up in external reporting. That separation keeps the operating story honest and helps auditors, investors, and department heads read the same ledger without confusion.
As a reference point for how customer-facing systems and finance logic can diverge, the conversation around conversational AI in banking CX shows why upstream service events often have downstream reporting effects. When support outcomes affect returns or retention, the income statement can't be treated as a standalone artifact.
Use Cases and SaaS Nuances
Retail, manufacturing, and services all pressure these metrics in different ways. A retailer may have heavy returns and promotions. A manufacturer may deal with allowances tied to defects or delayed shipments. A services business may care more about when work is completed than when cash arrives. In each case, gross sales tells you what was sold, but it doesn't tell you what survived the adjustment process.
Why SaaS needs special treatment
Subscription businesses complicate the picture further. A signed contract is not the same thing as recognized revenue, because recognition follows delivery or service fulfillment rather than the signing date. Recent guidance notes that a $60K annual contract may show only $2.5K in quarterly recognized revenue because of monthly recognition (Monday.com on revenue versus sales). That's the core trap in SaaS reporting, gross bookings or gross sales can look healthy while reported revenue moves much more slowly.
That gap changes how leaders should read the numbers. Sales teams may celebrate closed deals, finance may wait for recognition, and operations may be somewhere in the middle, tracking implementation, usage, and renewals. If those teams use the same word for different economic events, forecast calls turn into reconciliation exercises.
Closed deals are not the same thing as recognized income, and in subscription businesses, confusing them usually makes the forecast too aggressive.
The practical answer is to keep operational metrics separate. Gross sales or bookings can support pipeline analysis, while recognized revenue should drive margin modeling and external reporting. Once that separation is clear, subscription businesses can forecast more carefully without pretending every contract turns into immediate top-line impact.
Reporting and KPI Implications
Gross sales and revenue serve different jobs in the reporting stack. Gross sales is the demand metric. Revenue is the accounting result. If the business wants to understand how much work sales, CX, and operations are creating, gross sales belongs in the conversation. If the business wants to understand what the company reported, revenue has to lead (DataStudios on analytics and forecasting).
How each metric feeds KPIs
Gross sales supports pipeline-throughput thinking. It can be used to understand the speed and volume of transactions before the business absorbs deductions or recognition timing. Revenue supports outcome-based KPIs such as margin analysis, board reporting, and financial planning because it reflects the amount the business can defend in formal reporting.
That difference matters in operating dashboards. If CX teams are measured only on gross sales, they can miss the downstream effect of returns or allowances. If operations teams are judged only on revenue, they may lose visibility into the demand engine that created the result in the first place. The right dashboard connects both.
Normalization keeps comparisons honest
Different product lines, geographies, and business models should not be forced into the same metric without adjustment. A software business with deferred recognition and a retail business with immediate shipment both produce “sales,” but those figures don't behave the same way. Normalizing the data before comparing teams, regions, or channels prevents false conclusions about performance.
For a practical planning lens, it helps to ask which number should drive the decision. Forecasting cadence, pricing changes, and channel health often start with gross sales. Board materials, financial controls, and margin review should start with revenue. That division keeps each audience focused on the metric it can act on.
For teams building internal ROI models, the logic behind Yellow.ai's ROI calculator is a useful reminder that value has to be measured in the context of outcomes, not just activity. The same discipline applies here. Activity belongs in gross sales, outcomes belong in revenue.
Best Practices for Finance and Operations Leaders
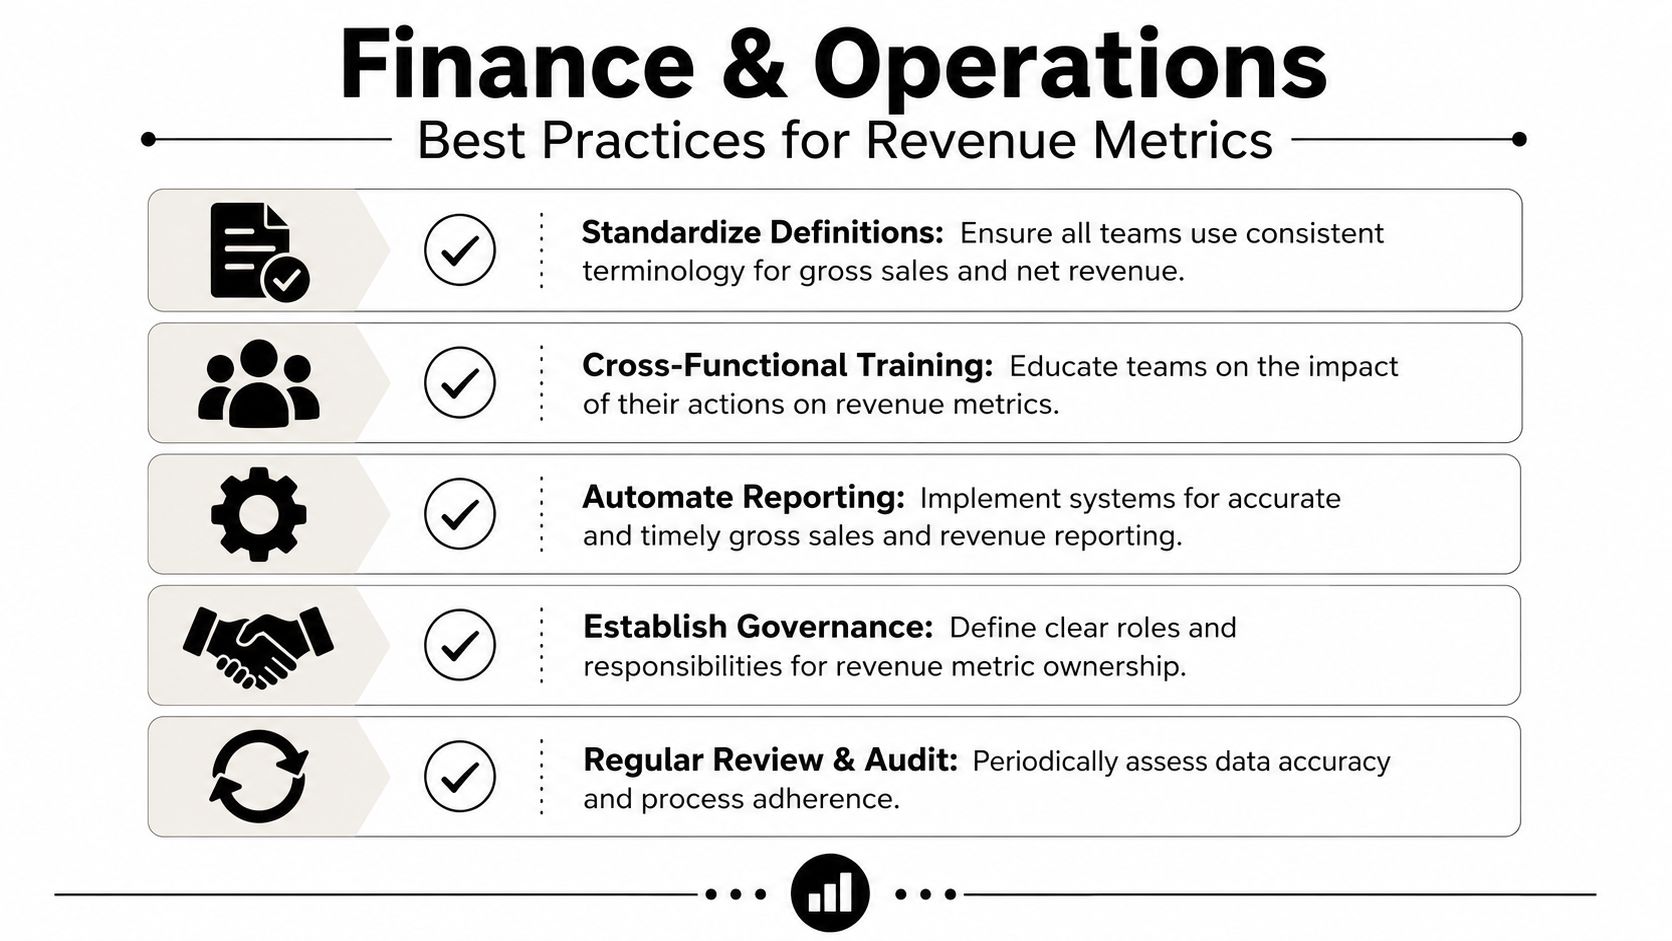
The cleanest reporting systems don't rely on memory or tribal knowledge. They rely on definitions, controls, and repetition. Finance, sales, CX, and operations should agree on exactly what qualifies as gross sales, what gets deducted, and when a transaction becomes revenue in the official report.
The governance checklist that actually works
- Standardize definitions. Write down what gross sales, net sales, and revenue mean for your company, then lock those definitions into reporting templates.
- Reconcile monthly. Compare transaction data, adjustments, and recognition schedules before the numbers reach leadership.
- Automate where possible. Use ERP and BI rules to classify deductions and other income consistently instead of relying on manual spreadsheets.
- Assign ownership. Finance should own the final revenue definition, while sales and CX should own the inputs that affect deductions and timing.
- Audit the exceptions. Review deferred revenue schedules, returns, and allowances regularly so outliers don't slip into board materials.
Keep the operating story and reporting story aligned
The most common failure I see is simple. Sales celebrates a gross number, finance reports a net number, and no one explains the bridge between them. That gap creates unnecessary friction and usually leads to bad decisions about pricing, customer experience, or even headcount.
A better process is cross-functional and repetitive. Sales teams should know how deal structure affects recognition. CX teams should know how service issues affect returns and allowances. Finance teams should publish the bridge in language the operating teams can read without an accounting degree. That's how the company stops arguing over labels and starts managing actual performance.
For a broader perspective on how automation and AI can support finance workflows, the discussion in Yellow.ai's finance and accounting podcast is a useful complement to the controls above. The point isn't to replace judgment. It's to reduce manual noise so leaders can spend more time on decisions and less on reconciliation.
If you're cleaning up a board deck, redesigning a KPI dashboard, or fixing a forecast that keeps missing the mark, start by separating gross sales from revenue in your source systems and reporting templates. Then align finance, CX, and operations around one bridge that explains the difference every month. If you want to streamline that process, explore Yellow.ai.