











You've built the spreadsheet. It shows thousands of labor hours recovered, a promising deflection assumption, and a payback period that should satisfy the steering committee. Then the CFO asks what happens when integration runs late, adoption stalls, language-model usage rises, or compliance work expands. The business case suddenly looks less like an investment decision and more like a hopeful estimate.
A defensible automation ROI calculation treats automation as a finance-grade operating investment. It accounts for total cost of ownership, measurable and qualitative benefits, timing, risk, and the capabilities the platform will deliver. That matters even more for agentic AI, where autonomous resolution, retrieval-augmented generation, and proactive orchestration can create value beyond simple task substitution.
Table of Contents
- Why Labor Savings Alone Will Not Defend Your Automation Case
- Defining Scope, Timeline, and Baseline Before You Model Anything
- Mapping Every Cost and Benefit on Both Sides of the Equation
- Running the Numbers With ROI, Payback, NPV, and IRR
- Stress Testing the Case With Sensitivity and Scenario Analysis
- Pitfalls That Sink Year One ROI and How to Defend Against Them
- Your Pre Submission Checklist and 90 Day Review Cadence
Why Labor Savings Alone Will Not Defend Your Automation Case
Labor savings are useful, but they're a weak standalone argument. A contact center may recover agent hours without reducing payroll, because leaders redeploy people to more complex work. An HR team may shorten case handling without eliminating a role. If your model counts every recovered hour as cash savings, finance will challenge the assumption immediately.
The buyer conversation has also changed. Agentic AI can resolve requests, retrieve knowledge, route work, trigger actions, and coordinate across systems. That expands the value pool beyond labor substitution, but it also introduces more dependencies. Your model now needs to address service quality, customer outcomes, data access, controls, and the cost of maintaining autonomous behavior.
Finance teams expect automation to withstand the same scrutiny as other capital or operating investments. That means documenting the baseline, separating cashable benefits from capacity gains, and showing what happens when the main assumptions miss. Board-level scrutiny also makes integration, compliance, and customer-experience regression impossible to treat as footnotes.
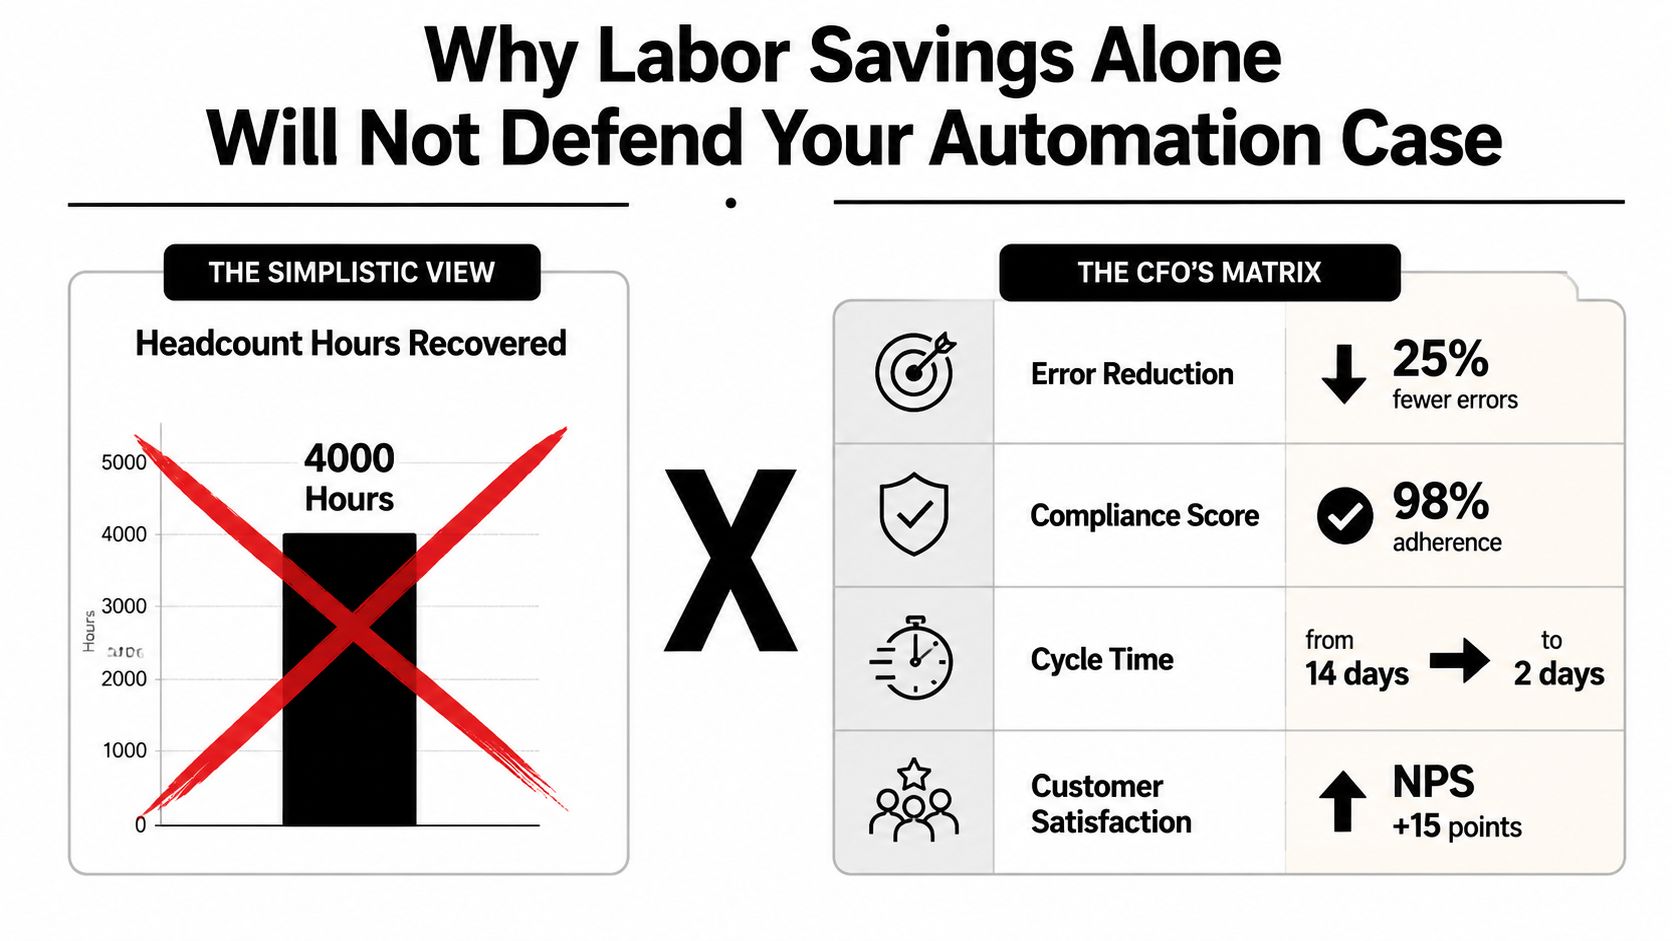
Build the case finance can audit
Use four lenses:
- Total cost of ownership: Include licensing, implementation, integrations, usage, security, training, tuning, support, and governance.
- Hard benefits: Count avoidable labor, rework, overtime, vendor expense, and other benefits that finance can reconcile to actual budgets.
- Operational benefits: Track faster cycle times, higher first-contact resolution, improved containment, and stronger employee or customer experience separately from cash savings.
- Downside exposure: Model adoption delays, lower intent coverage, integration overruns, model drift, compliance exceptions, and higher consumption.
The benchmark evidence reinforces why a broader model matters. Workflow automation ROI benchmarks commonly report median first-year ROI in the 200% to 400% range, with breakeven typically reached in 2 to 4 months. The same reference reports a median first-year ROI of 250% to 350% and says 15% of organizations experience negative first-year ROI, often because of overscoped implementations or weak training. Treat those figures as context, not as a substitute for your own baseline.
For additional practical ideas, leaders can browse productivity automation posts while shaping the operational scope. Your final submission should still stand on your internal data and documented assumptions.
Defining Scope, Timeline, and Baseline Before You Model Anything
The quality of an automation ROI calculation is fixed before anyone opens a calculator. Lock scope, decision horizon, and baseline first. If any of those variables remain vague, the model will reward ambition instead of measuring a decision.
Start with a precise scope
Name the exact process, channels, users, and exceptions. For CX, specify ticket categories, self-service intents, voice and digital channels, escalation paths, and handoffs. For EX, define the workflow, such as onboarding, payroll questions, benefits changes, access requests, or offboarding.
A contact center might scope tier-one password resets and order tracking across voice and chat. That scope is testable. “Automate customer support” isn't. The first version should also state what remains outside automation, including authentication failures, sensitive account changes, and cases requiring a human judgment.
Set the decision horizon
Match the horizon to the platform and procurement reality. Cloud AI programs often need a 36-month view, while regulated on-premises environments may require a longer period because infrastructure, approval, and upgrade cycles differ. Use the same horizon for costs and benefits, then document why you chose it.
Establish an observable baseline
Use recent operational records rather than optimistic stakeholder estimates. Capture:
- Volume: Monthly contacts, cases, requests, and transactions.
- Work effort: Average handle time, after-contact work, queue time, and escalation effort.
- Experience: Customer satisfaction, employee satisfaction, first-contact resolution, and complaint patterns.
- Quality: Error rates, rework, transfer rates, fallback behavior, and audit findings.
- People impact: Attrition, absence, training load, and redeployment capacity.
For the contact-center example, the baseline is 480 monthly tickets at 6.2 minutes average handle time. That doesn't yet prove savings. It gives finance a traceable starting point from which to test containment, handling effort, escalation, and cashability.
| Field | What to Capture | Example |
|---|---|---|
| Process | Exact journey and exception boundary | Password resets and order tracking |
| Channel | Voice, chat, email, portal, or internal service channel | Voice and chat |
| Population | Users, agents, customers, or employees in scope | Tier-one support population |
| Volume | Recent recurring workload | 480 monthly tickets |
| Effort | Average handle time and related work | 6.2 minutes per ticket |
| Horizon | Period used for investment decisions | 36 months |
| Baseline outcomes | Experience, quality, and escalation measures | CSAT, transfers, errors, fallback |
Use a structured evaluation framework such as this buyers guide to evaluating conversational AI solutions to pressure-test scope and platform requirements. The key discipline is simple: every benefit in the model must point back to a process and baseline that someone can verify.
Mapping Every Cost and Benefit on Both Sides of the Equation
A steering committee will audit the ledger, not admire the headline. Put every expected cost and benefit into a line item, assign an owner, and record whether the value is cash, capacity, risk reduction, or experience improvement.
The cost side starts with the obvious items: platform licensing, implementation, integrations, configuration, and internal project labor. It then expands into the work enterprises routinely underestimate. AI-enabled automation can require language-model usage at scale, ongoing evaluation, prompt maintenance, legacy-system integration, and change-management and training. Independent guidance estimates that these hidden first-year costs can add 30% to 50% to headline build cost. See the analysis of AI automation ROI and hidden costs for the underlying warning.
Security review, identity integration, audit logging, privacy controls, compliance testing, infrastructure, monitoring, premium support, and process redesign belong in the same ledger. If the agent uses retrieval-augmented generation, include knowledge-base preparation, permissions, content governance, and evaluation. If it acts autonomously, include action validation, exception handling, human escalation, and incident response.
Benefits need equal discipline. Labor savings may be cashable, but capacity released for higher-value work is not the same as payroll reduction. Error reduction can lower rework and customer remediation. Faster cycle times may preserve revenue or improve conversion, but finance needs a defensible attribution method. Autonomous resolution can combine cost avoidance with revenue preservation when customers complete a journey that would otherwise require expensive intervention.
For broader operational context, the 2025 automation benefits guide is useful when cataloguing value categories. Use it to expand the discussion, not to copy generic benefits into your forecast.
| Side | Category | Definition | Year 1 Risk |
|---|---|---|---|
| Cost | License and consumption | Platform fees, model usage, channels, and transaction charges | Usage exceeds forecast |
| Cost | Implementation | Configuration, solution design, testing, and launch support | Scope expands |
| Cost | Integration | CRM, ERP, identity, telephony, knowledge, and workflow connections | Legacy interfaces delay launch |
| Cost | Change management | Communications, training, operating-model changes, and adoption support | Teams keep using old paths |
| Cost | Evaluation and tuning | Prompt maintenance, quality review, model monitoring, and content updates | Maintenance effort is omitted |
| Cost | Security and compliance | Reviews, controls, audit evidence, redaction, and access governance | Approval arrives late |
| Benefit | Labor and rework | Avoidable handling effort, repeat work, overtime, and corrections | Savings aren't cashable |
| Benefit | Resolution and containment | More requests completed without transfer or escalation | Intent coverage is overstated |
| Benefit | Experience | CSAT, employee satisfaction, first-contact resolution, and journey quality | Attribution is weak |
| Benefit | Revenue preservation | Faster response, fewer abandoned journeys, and retained demand | Finance rejects unsupported lift |
A platform with agentic capabilities can change several rows at once. A knowledge-grounded agent may raise resolution value while increasing content-governance work. Proactive orchestration may reduce inbound volume while adding workflow and consent requirements. Advanced analytics, such as the capabilities described in AI analytics for conversational operations, can help teams reconcile usage, outcomes, fallbacks, and operational variance after launch.
Running the Numbers With ROI, Payback, NPV, and IRR
One metric won't answer every finance question. Use ROI to compare value against cost, payback to show how quickly the investment returns cash, NPV to account for time value, and IRR to express the project's implied rate of return.
The core formulas are:
- ROI:
((Net Benefit - Total Cost) / Total Cost) × 100 - Payback:
Total Investment / Annual Net Cash Inflow - NPV:
Σ [Cash Flow in Period t / (1 + Discount Rate)^t] - Initial Investment - IRR: The discount rate that makes NPV equal to zero.
For the worked example below, assume a 50-seat contact center deploys agentic AI for tier-one deflection. Year-one cost is $420,000, and year-one gross benefit is $680,000. Net benefit is therefore $260,000, and the simple ROI is 61.9%, calculated as (680,000 - 420,000) / 420,000 × 100. These figures are a supplied illustration, not a benchmark.
| Line Item | Year 1 | Year 2 | Year 3 |
|---|---|---|---|
| Total cost | $420,000 | $210,000 | $210,000 |
| Gross benefit | $680,000 | $680,000 | $680,000 |
| Net cash flow | $260,000 | $470,000 | $470,000 |
| Discount rate | 10% | 10% | 10% |
The payback calculation uses the initial investment and annual net cash inflow. On the supplied figures, $420,000 / $680,000 produces 0.618 years, or roughly 7.4 months, if gross benefit is treated as the annual cash inflow. If your organization defines payback using net cash flow instead, use that convention consistently and label it clearly.
A three-year discounted cash-flow model using a 10% WACC produces an NPV of approximately $387,000 under the supplied example assumptions, with an IRR of approximately 54%. The Yellow.ai ROI calculator can help structure an AI-agent estimate, but finance should still inspect the assumptions, cashability, and discount-rate logic.
Finance rule: Report simple ROI, payback, NPV, and IRR together. Never let a strong IRR conceal weak cash timing or an inflated benefit assumption.
IRR becomes misleading when cash flows change sign multiple times, when terminal cash flows are tiny but dominate the result, or when the project period is shorter than the payback period. In those cases, NPV and cash payback deserve priority.
The CFO will usually demand cash timing, total cost of ownership, and downside risk before approving the investment. ROI opens the conversation. NPV, payback, and a documented sensitivity range defend the signature.
Stress Testing the Case With Sensitivity and Scenario Analysis
The base case is an assumption set, not a forecast you can trust automatically. A serious model changes the inputs that operations can miss, then shows how those changes affect value.
Build a tornado-style view of NPV. Rank inputs by financial impact, starting with the variables most connected to real operating behavior:
- Deflection rate: Intent coverage, authentication success, and escalation quality determine whether autonomous resolution replaces work or adds another layer.
- Average handle time saved: A shorter interaction matters only when the organization can convert the time into capacity or expense avoidance.
- License cost per seat or usage unit: Consumption can rise as adoption expands or agents handle longer, more complex journeys.
- Integration overrun: Legacy CRM, ERP, identity, telephony, and knowledge connections can shift launch cost and timing.
- Adoption ramp: Agents, customers, and employees may continue using established channels after launch.
The supplied planning example says a 20% miss on deflection rate can move NPV by roughly $180,000, while a 15% integration overrun moves it by about $60,000. Treat those values as scenario inputs for that example, not universal effects. Your own model should replace them with sensitivity outputs from your baseline and cash-flow schedule.
| Metric | Conservative | Base | Upside |
|---|---|---|---|
| Benefit assumption | 60% of base benefit | Base benefit | 110% of base benefit |
| Cost assumption | 130% of base cost | Base cost | 95% of base cost |
| Adoption | Delayed and uneven | Planned ramp | Faster acceptance |
| Deflection | Lower intent coverage | Validated target | Broader successful resolution |
| Decision | Re-baseline or phase | Proceed with controls | Expand after validation |
Agentic capabilities alter the deflection band because they can do more than answer questions. Retrieval over approved knowledge, autonomous actions, and proactive orchestration may increase the number of journeys an agent can complete, but only when permissions, data quality, and exception handling work in production. Don't widen the upside range merely because the platform has more features.
Use a three-point estimate for board materials when the data is limited. For higher-stakes programs, run Monte Carlo analysis across volume, adoption, deflection, cost, and timing. Include model drift, agent attrition, policy changes, and fallback rates. The board needs to see not only the expected return, but also how quickly the case weakens when operations depart from plan.
Pitfalls That Sink Year One ROI and How to Defend Against Them
Most failed business cases don't fail because the ROI formula is wrong. They fail because the numerator is inflated, the denominator is incomplete, or the implementation team never proves the operating assumptions.
Legacy integration is the first trap. CRM, ERP, identity, telephony, and knowledge systems rarely expose clean workflows without preparation. Ask vendors to identify every required connector, custom interface, data transformation, environment, and dependency before procurement approves the business case.
Security and compliance create a second failure point. SSO, access controls, audit logs, PII redaction, retention policies, human escalation, and evidence collection can all require work outside the platform license. Bring the identity, security, privacy, and compliance teams into discovery early, not after the business has announced a launch date.
LLM-backed agents add consumption and quality-management risks. License fees aren't the entire vendor line. Include model usage, premium support, professional services, evaluation, prompt maintenance, knowledge curation, and monitoring. If the contract doesn't explain how these costs scale, the model isn't ready for approval.
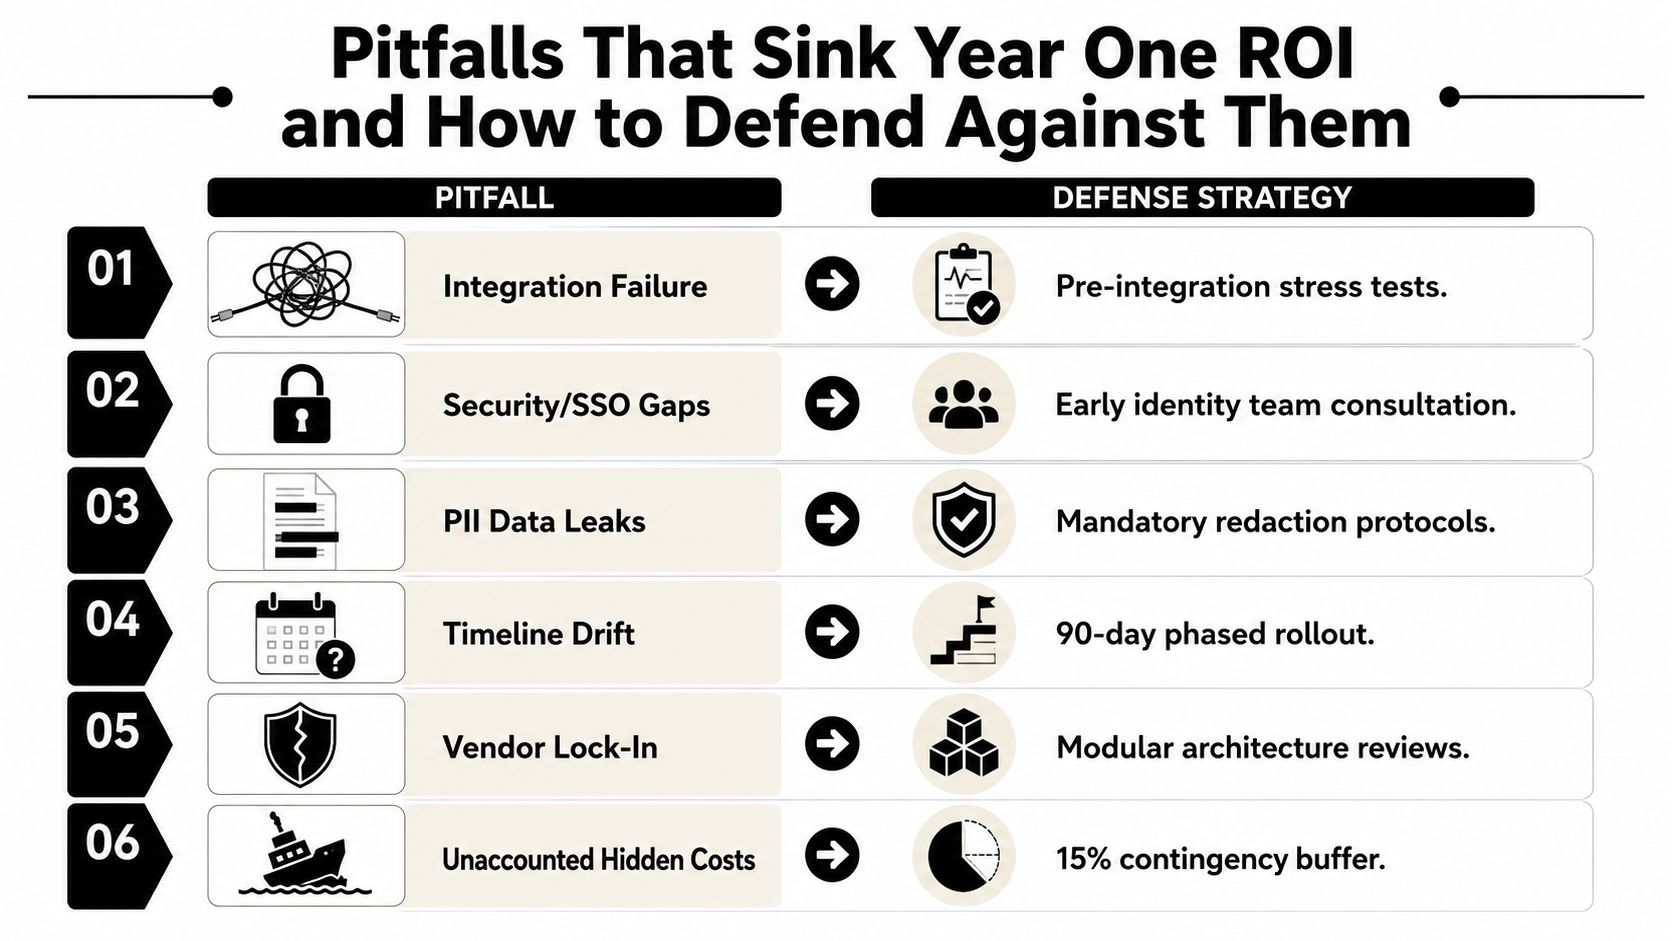
Tie every risk to a defense
- Integration failure: Require pre-integration stress tests and a written dependency register.
- Security and SSO gaps: Schedule identity-team review before committing to the production timeline.
- PII exposure: Make redaction, access control, test data, and retention protocols pilot exit criteria.
- Timeline drift: Use a phased rollout with explicit acceptance gates rather than one large launch.
- Vendor lock-in: Review modular architecture, data portability, model options, and exit terms.
- Hidden costs: Add a documented contingency and reconcile actual invoices to the approved model.
Don't double-count benefits from an existing RPA program, workforce plan, or process redesign. Don't present better morale, faster service, or reduced risk as hard savings unless finance accepts the attribution method. Soft benefits can strengthen the case, but they shouldn't masquerade as budget removal.
Deflection deserves particular discipline. A bot that answers an intent isn't necessarily reducing cost if the customer still contacts an agent, repeats information, or triggers a complaint. Require a paid pilot KPI that defines successful resolution, fallback, transfer, repeat contact, and customer-experience guardrails.
Procurement requirement: Ask every vendor to disclose year-one total cost of ownership, including services and consumption, and to commit in writing to pilot-based deflection benchmarks before contract signing.
Your Pre Submission Checklist and 90 Day Review Cadence
A steering committee should receive an auditable artifact, not a persuasive slide deck. The package needs to show where every input came from, who owns it, and what evidence will confirm it after launch.
Use a 20-item pre-submission checklist covering five groups:
- Data integrity: Confirm the volume period, baseline definitions, source systems, exclusions, seasonality, and reconciliation to finance records.
- Benefit controls: Separate cash savings, capacity, experience, risk reduction, and revenue preservation. Test for double counting and document soft-benefit attribution.
- Cost completeness: Include implementation, integration, usage, training, tuning, security, compliance, support, and contingency assumptions.
- Finance logic: Record the decision horizon, discount rate, cash-flow timing, ROI convention, payback definition, NPV, IRR, and sensitivity boundaries.
- Governance: Assign owners, document approvals, define pilot KPIs, capture compliance tolerances, and obtain final integration-cost sign-off.
The steering committee package should contain an executive summary, the model file, an assumption log, a risk register, baseline evidence, and a measurement plan. Keep the source data close to the model. A reviewer should be able to trace a claimed benefit from the summary to an operational metric and then to a finance treatment.
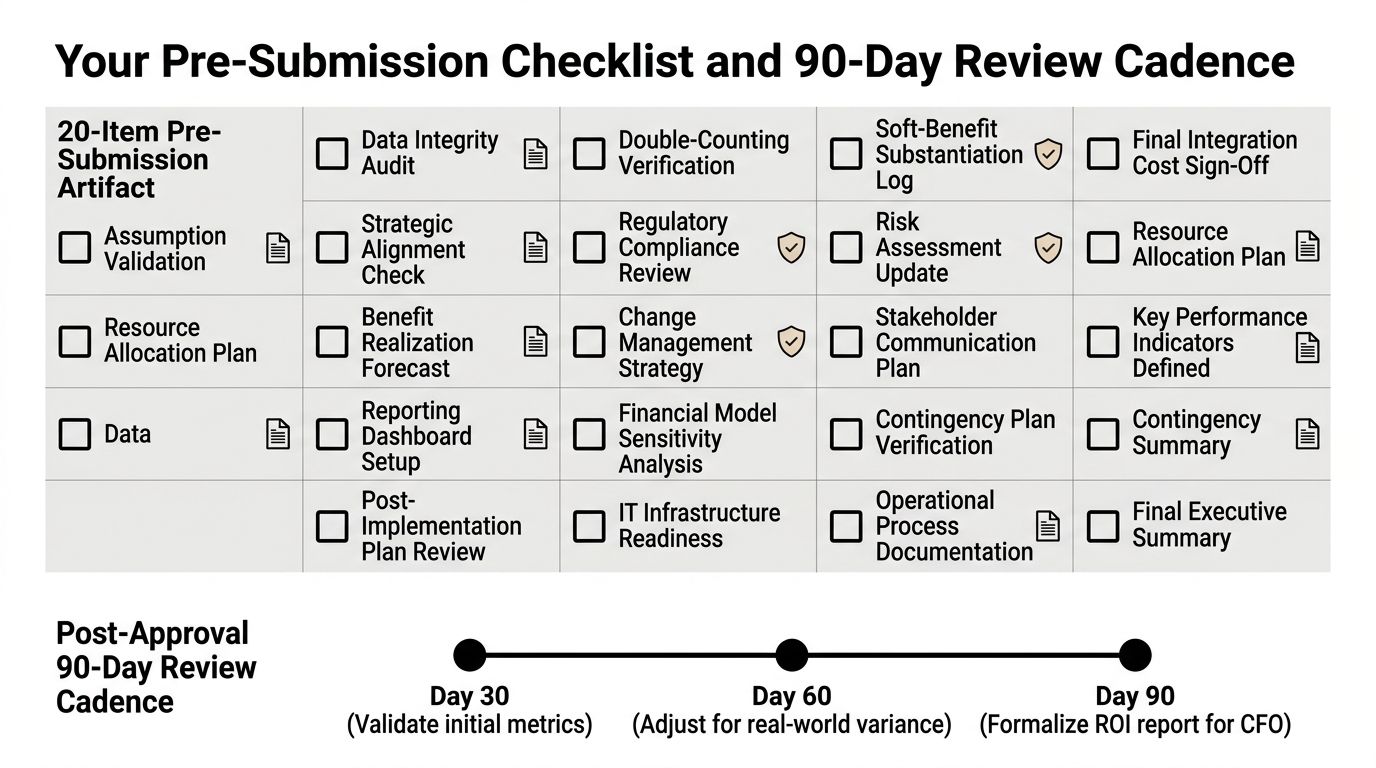
Review the investment after launch
Use a structured cadence:
- First month, weekly: Review adoption curves, ticket deflection, fallback rates, transfer behavior, and critical errors.
- Second month, bi-weekly: Reconcile platform and model costs, compare productivity deltas, and assess CSAT or NPS movement.
- Third month: Produce a formal variance report against the approved baseline, including benefit realization, run-rate cost, risks, and next-stage funding.
Three triggers should force a re-baseline rather than automatic continuation: actual payback exceeds 1.5 times the target, soft-benefit attribution falls below 40% of claimed value, or compliance exceptions exceed the defined tolerance. These are supplied governance thresholds, so your steering committee should approve them before launch.
The practical lesson is blunt. An automation ROI calculation isn't finished when the spreadsheet shows a positive return. It's finished when the organization can explain the assumptions, measure the operating reality, and stop or reshape the program when the evidence no longer supports it.
Yellow.ai provides enterprise agentic AI for CX and EX, including autonomous conversations across voice, chat, email, images, and video, agentic retrieval over enterprise knowledge, analytics, testing, and integrations with systems such as Salesforce, Zendesk, Genesys, and Freshdesk. Use the Yellow.ai platform to evaluate automation value with a documented baseline, complete cost model, and post-launch measurement plan.